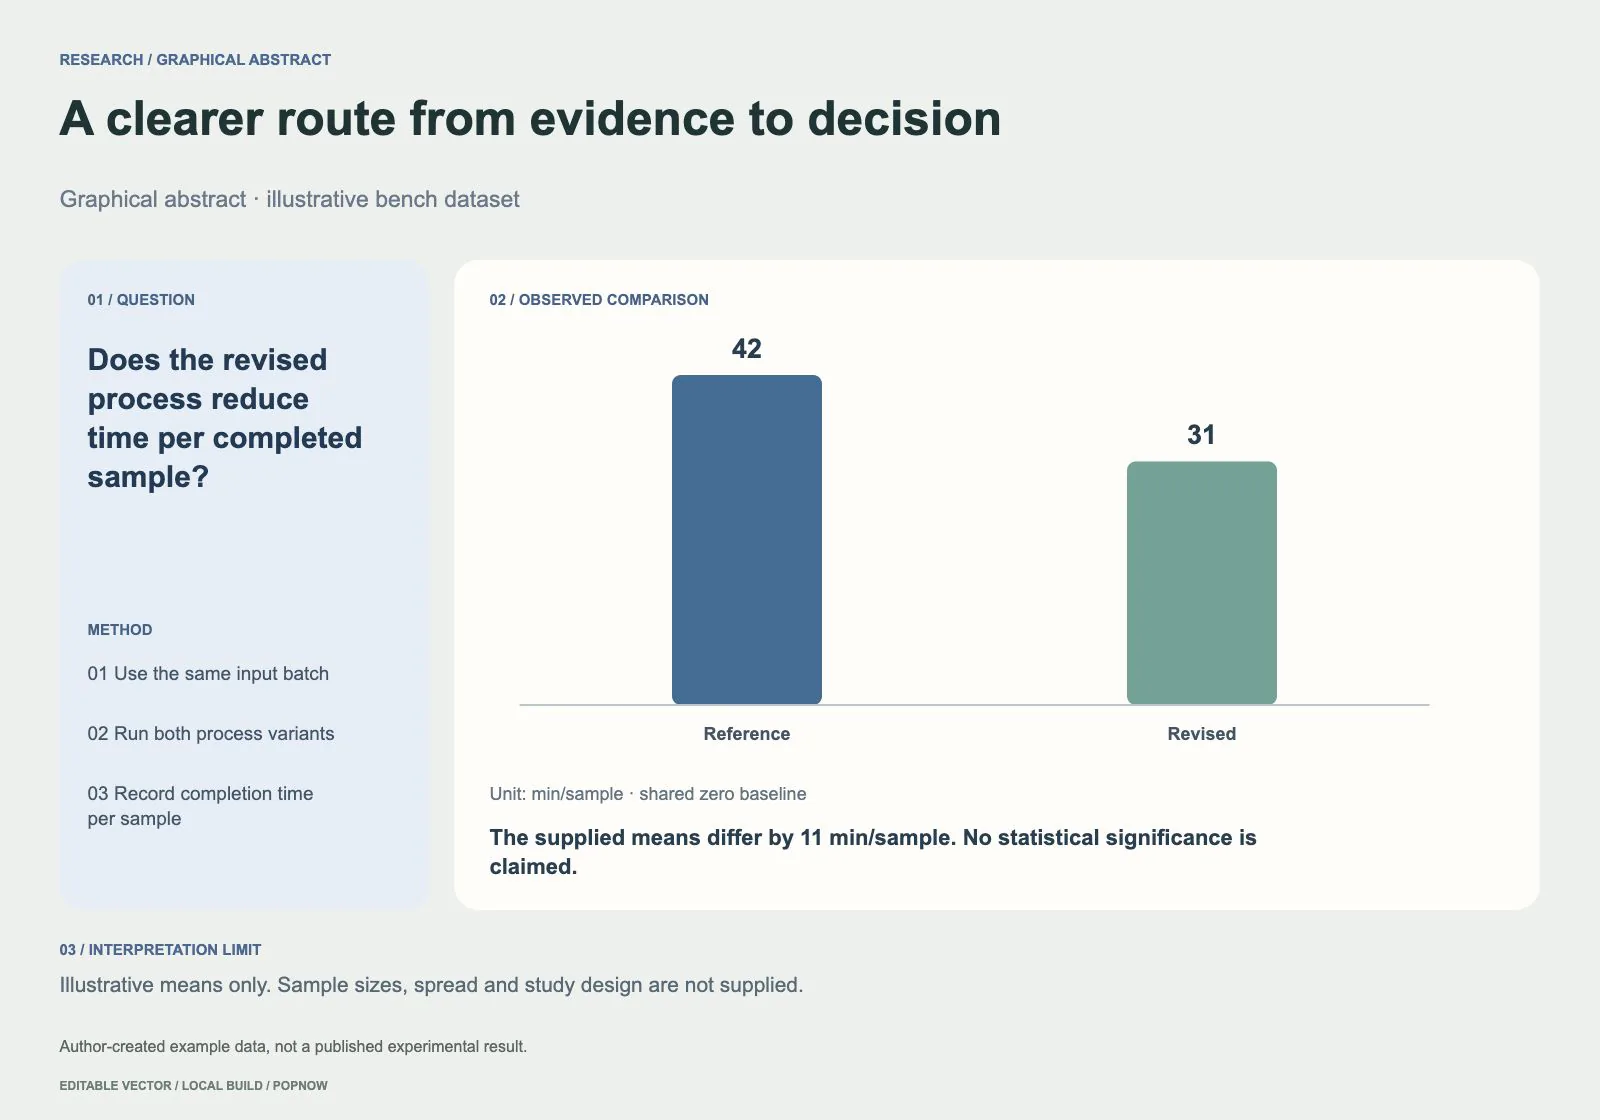
Turn a research brief into editable question–method–result artwork with source-linked measurements. Validate finite measurements, identical comparison units, unique group labels and complete source notes. Plot a shared zero-baseline chart and keep the research question, method, observed result and limitation separate. PopNow imagery is optional; the editable vector build works without a key.
- Uses PopNow for
- Images
- Needs
- Python 3
The skill is free. Optional AI images, video and sound are quoted for your approval before generation. API-key calls use your separate API balance in USD; generation through ChatGPT or Claude connected via OAuth/MCP uses your website credits.
v1.0.0 · Updated Oct 24, 2026 · 32 KB · Use it for personal and client work; please don't resell or share the package.
What you get
Editable SVG with live labels and named vector groups
HTML preview, source JSON and a validation report
Three distinct rendered examples with domain checks
Optional PopNow imagery after a quoted API USD approval
Good for
- Turn a research brief into editable question–method–result artwork with source-linked measurements.
- Teams that need exact labels, documented evidence and editable handoff files
Not for
- Not a literature search, statistical test or result generator. Means alone cannot establish uncertainty, significance or causation.
- Replacing expert review with a generated visual
How to use it
You say
Use the PopNow skill "Research Graphical Abstract" (research-graphical-abstract) for this: Turn a research brief into editable question–method–result artwork with source-linked measurements. Use my supplied data and keep the SVG editable.
Then try
Check the units, labels and sources before the final render.
Make a second composition and quote optional PopNow imagery first.
What to have ready
- A research question, two to four method steps, two to five measured groups with values, units and sources, a supported finding and a limitation.
- Verified sources and an existing DESIGN.md when available
- Final canvas, audience and permitted visual assets
Similar skills
View all →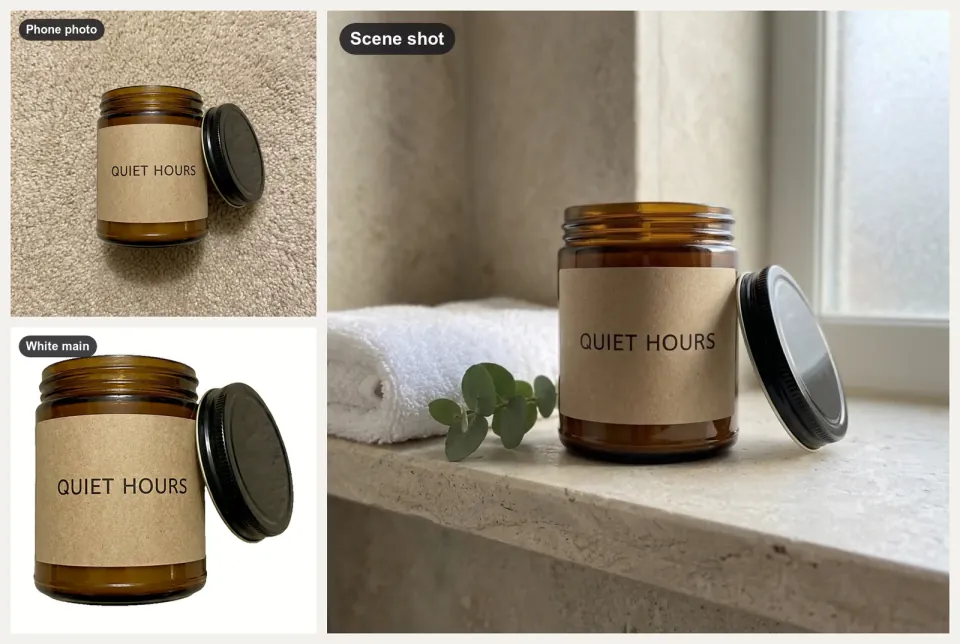 Image
Ecommerce Product Photo Studio
+25A folder of product snapshots in, white main images, scene shots and banners out, checked for Amazon and Etsy.
 Image
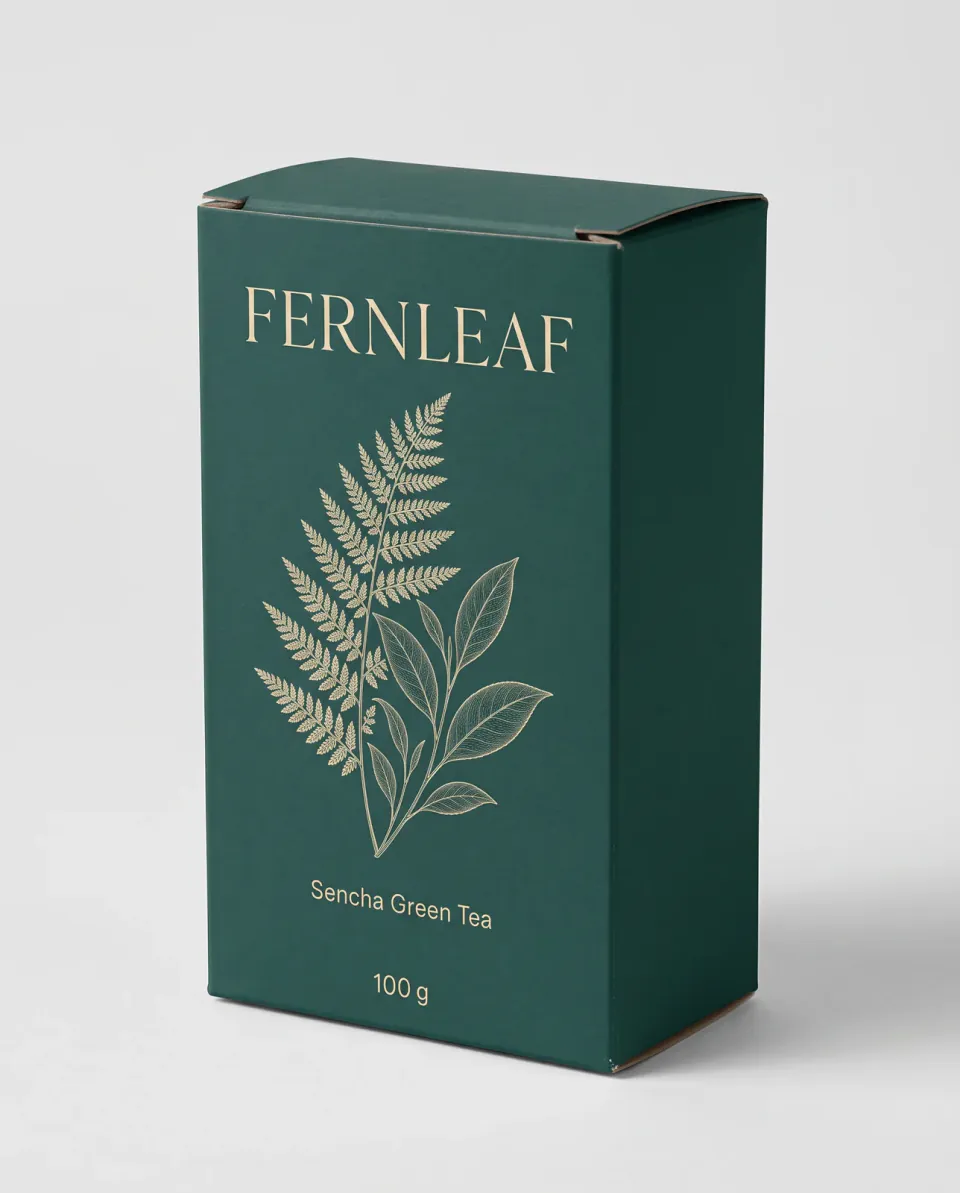
Packaging Mockup Generator
+25Your flat packaging art on boxes, pouches and jars, in shelf and unboxing scenes, checked word for word.
 Image
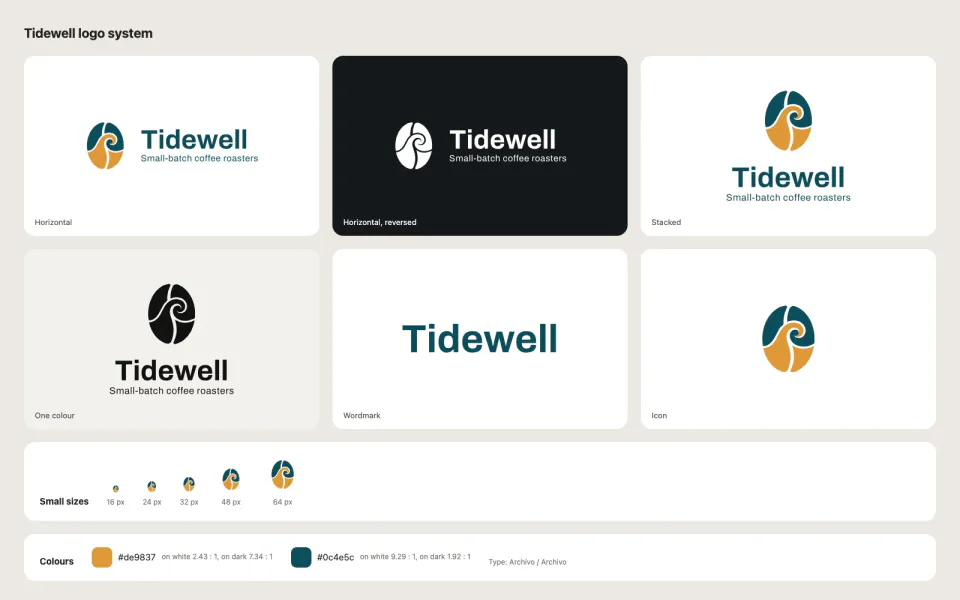
AI Logo Generator
+25Pick from 3-5 symbol directions, get an SVG logo kit with lockups, one-colour versions and favicons.
 Image
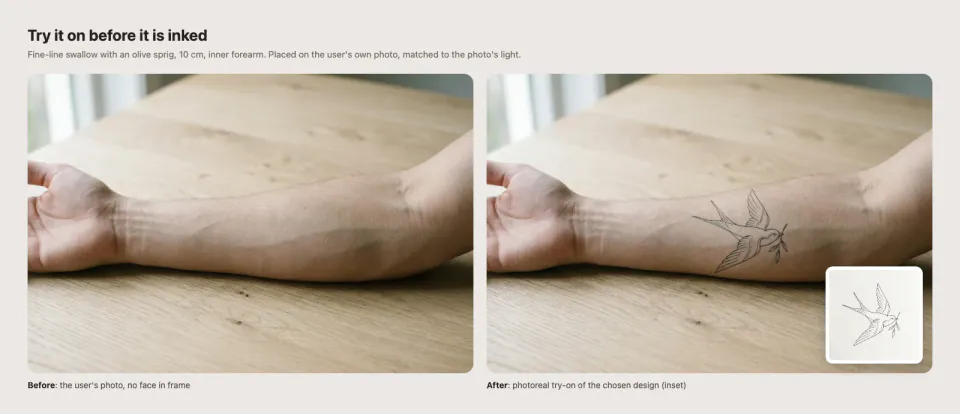
AI Tattoo Design Studio
+25Create your own tattoo design in three styles, then a real-size stencil and a try-on on your own photo.
 Image
AI Wallpaper Generator
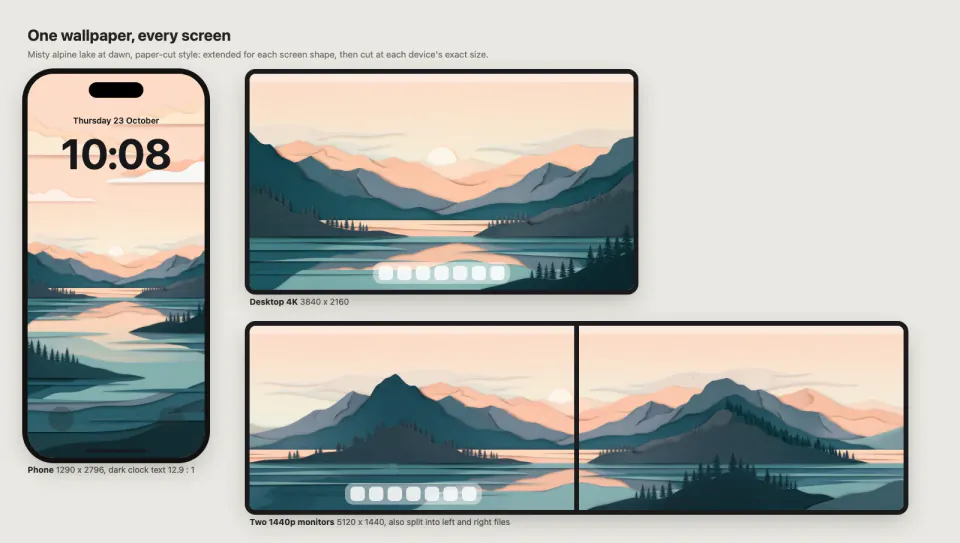
+25One original wallpaper, extended and upscaled for every screen: phones, 4K-5K, ultrawide and dual monitors.
 Image
Album Cover Art Kit
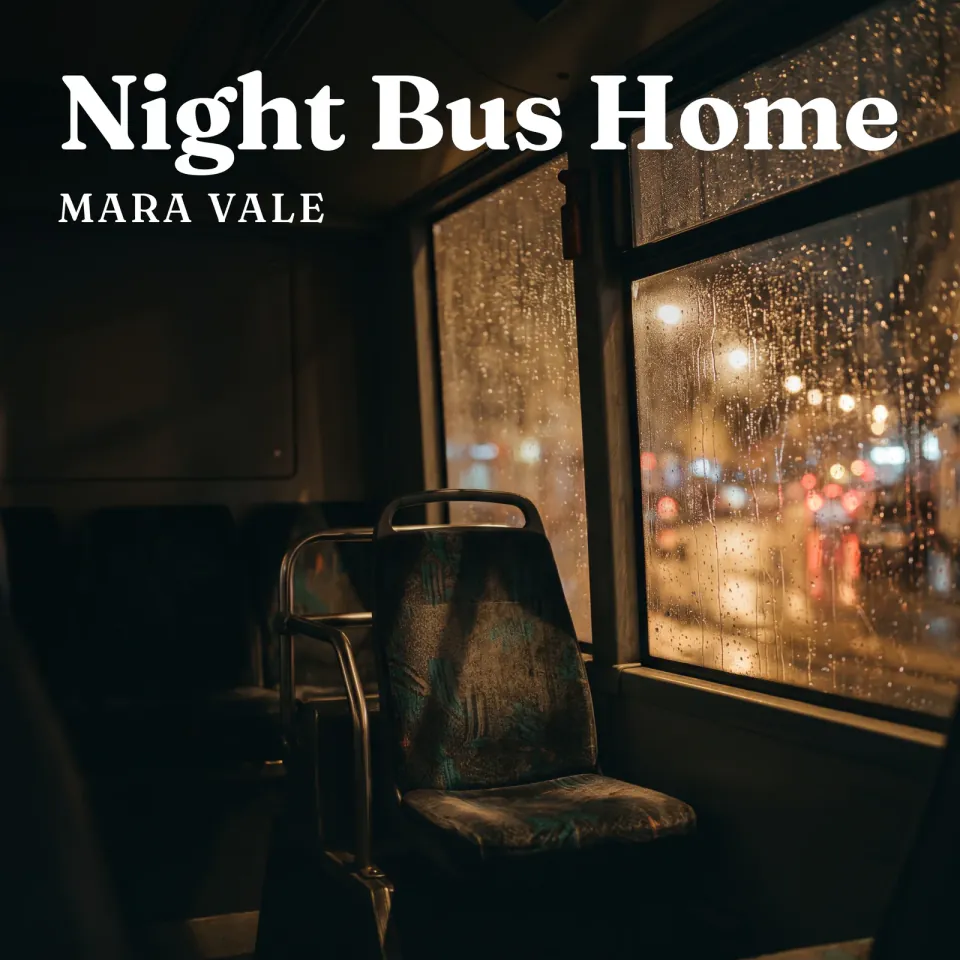
+25Song title and mood in, a 3000x3000 cover with exact type, a seamless loop and promo images out.
 Image
Amazon A+ Content Builder
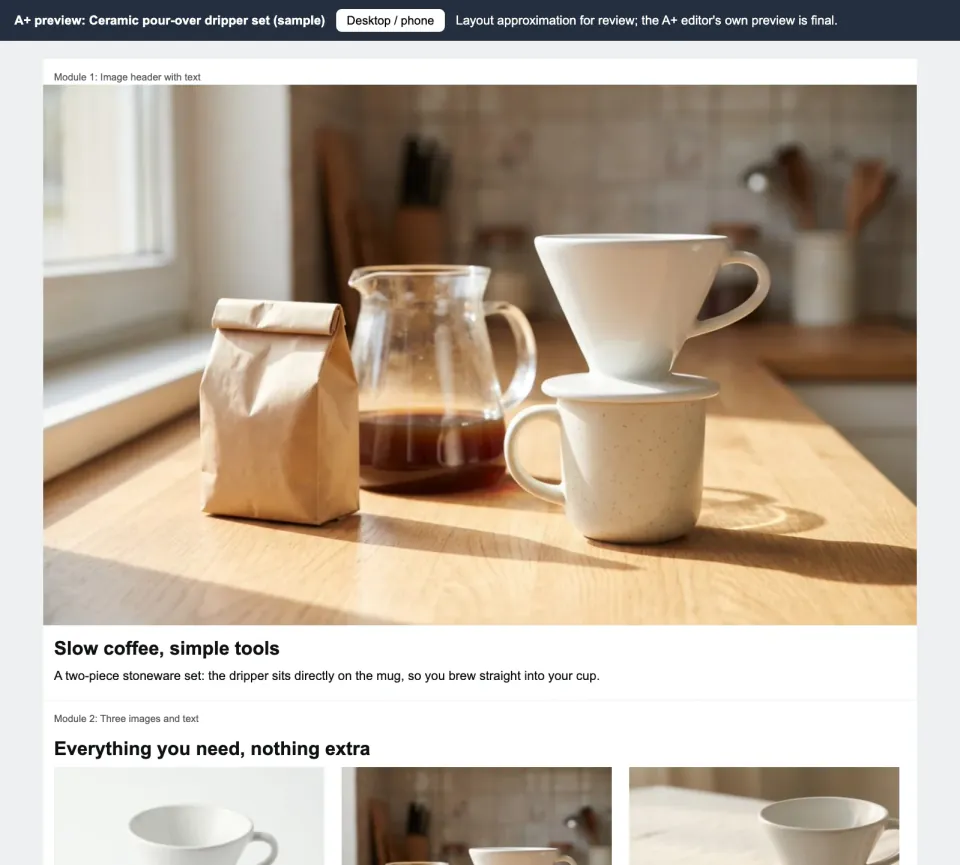
+25Product photos and facts in; exact-size A+ module images, claim-checked copy and a phone preview out.
 Image
App and UI Icon Generator
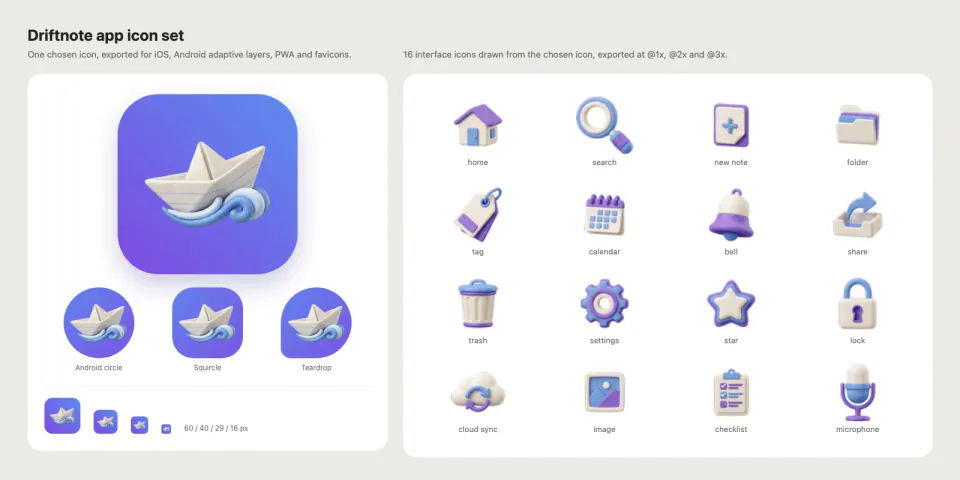
+25One app icon and 10-30 matching UI icons, exported for iOS, Android adaptive, PWA and favicons.
 Image
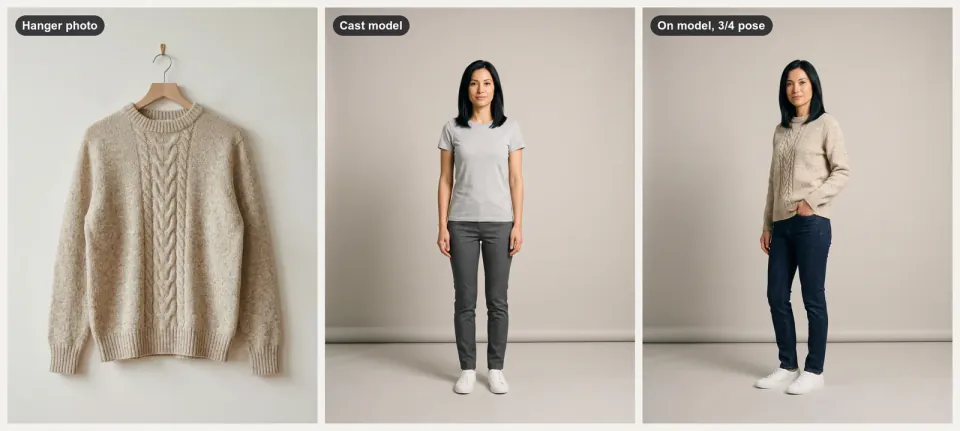
Apparel On-Model Lookbook
+25Flat-lay clothing photos in, a lookbook on one AI-generated model out, with poses, angles and walk clips.
 Image
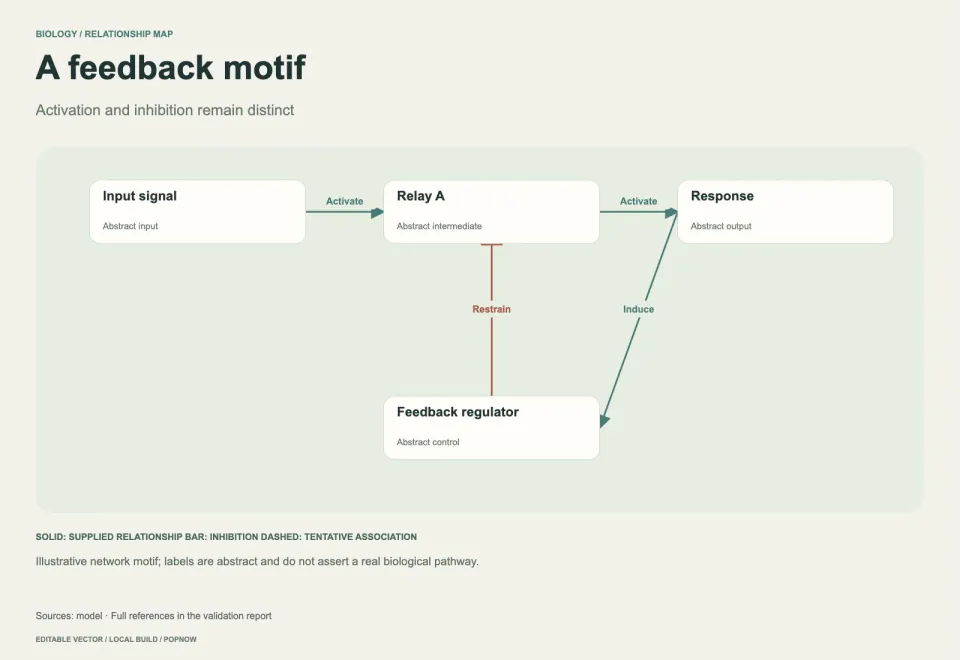
Biological Pathway Diagram
+25Create editable pathway maps with checked node links, explicit interaction types and evidence notes.
- Image
Black and White Studio Portrait
+25Turn an everyday photo into a calm black-and-white studio portrait that still looks like you.
- Image
Blog Post Illustration Set
+25Three matching illustrations for one article, each showing what its passage actually says.
 Image
Book Cover Designer
+25Title, author and genre in: three cover directions, an exact-type ebook cover and a print-ready wrap.
- Image
Brand Kit & DESIGN.md Generator
+25A brand kit from a short brief: checked palette, open fonts, SVG logo, mockups and a DESIGN.md agents follow.
 Image
Calm Illustrated OG Image Maker
+25Friendly link previews: ivory field, floating phones, soft doodles and a rounded headline, at 1200x630.
- Image
Car Cutaway Anatomy Poster
+25A side-view cutaway of a generic car: color-coded systems, numbered markers and round zoom windows.
 Image
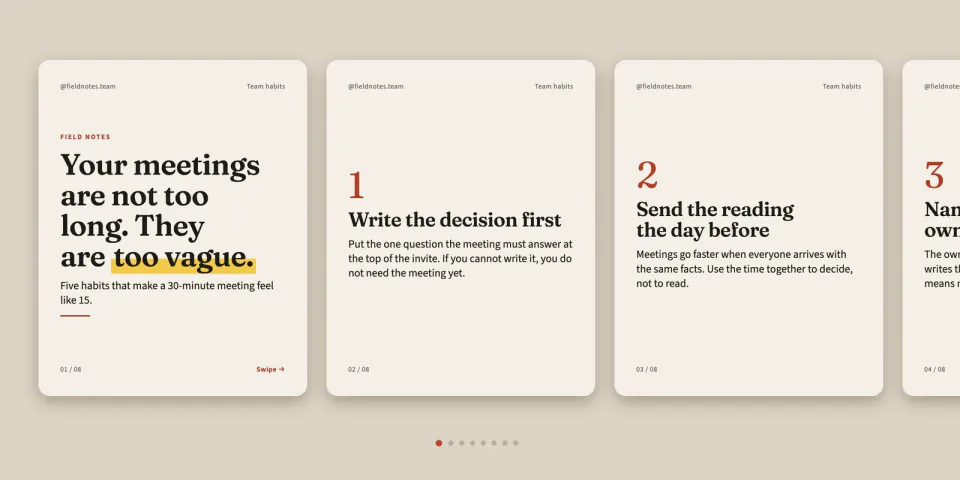
Carousel Post Maker
+25Article or opinion in, a 6-10 page carousel out: LinkedIn PDF, Instagram 4:5 and RedNote 3:4.
 Image
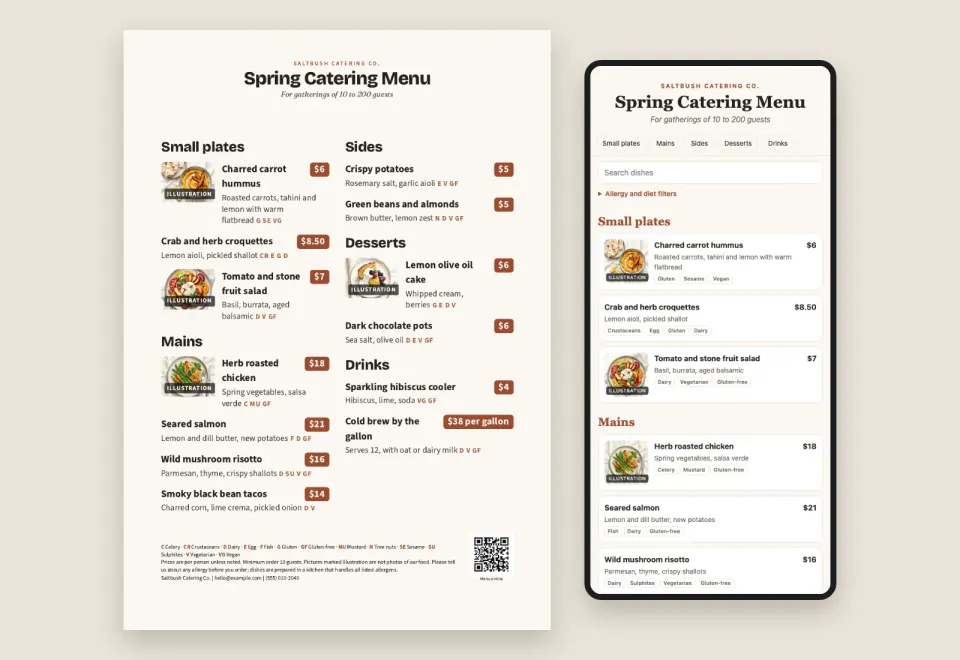
Catering Menu Designer
+25A menu spreadsheet in: a print menu, tri-fold, table tent and a phone menu for a QR code, prices checked.
- Image
Chalkboard Infographic Maker
+25A 16:9 chalkboard-style infographic with exact short copy, chalk drawings and one clear reading path.
- Image
Cinematic Storyboard Frames
+25Three storyboard contact sheets for one scene, each a different way to shoot it, with continuity kept.
 Image
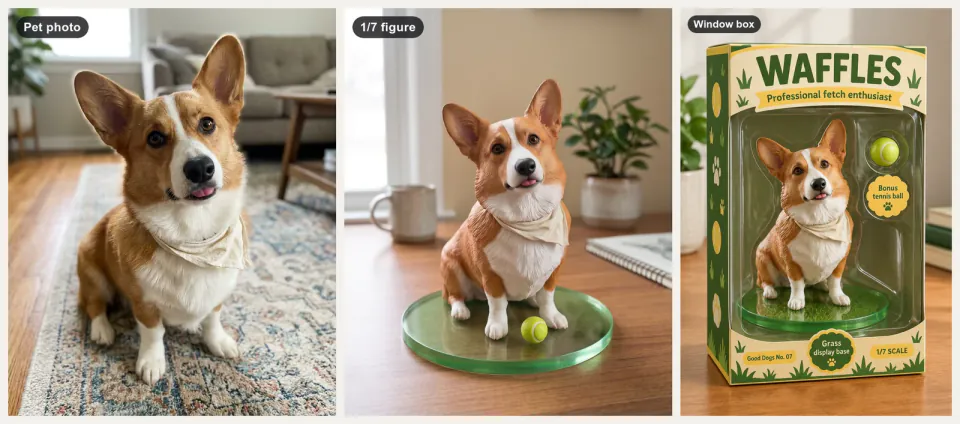
Collectible Figure Mockup
+25You, your pet or your own character as a desk figure, a boxed toy, a cut-out and a turntable clip.
 Image
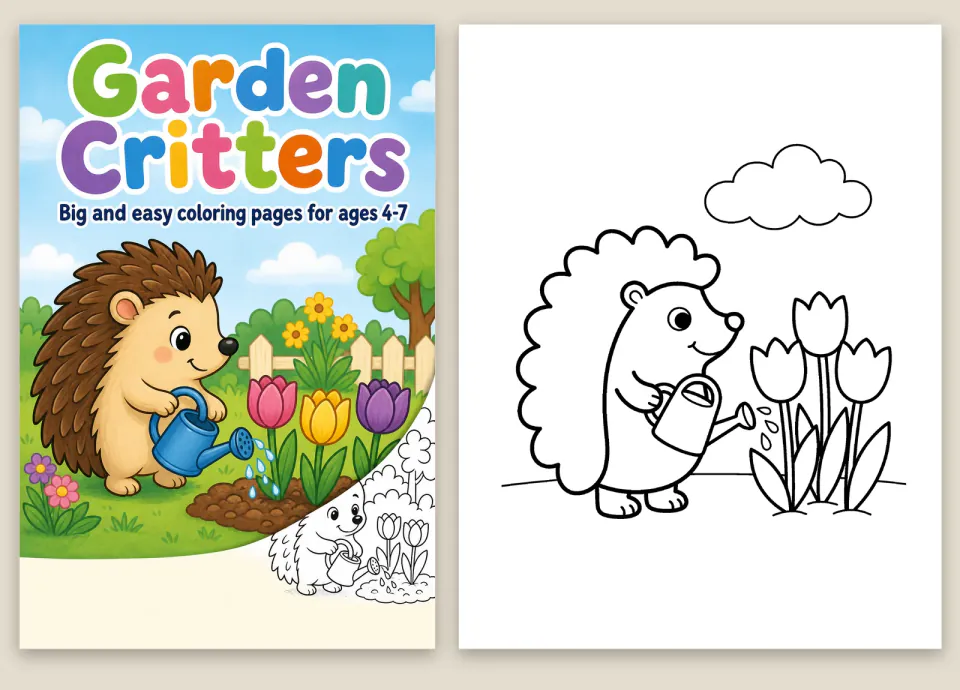
Coloring Book Generator
+25A theme in, a print-ready coloring book out: clean line art, 300 DPI pages and a paperback interior PDF.
 Image
Concept Metaphor Illustration
+25One idea, one hand-drawn visual metaphor: flat muted color, off-white cut shapes, loose black marker lines.
- Image
Consistent Concept Art Set
+25A character, a prop and an environment that clearly belong to the same fictional world.
 Image
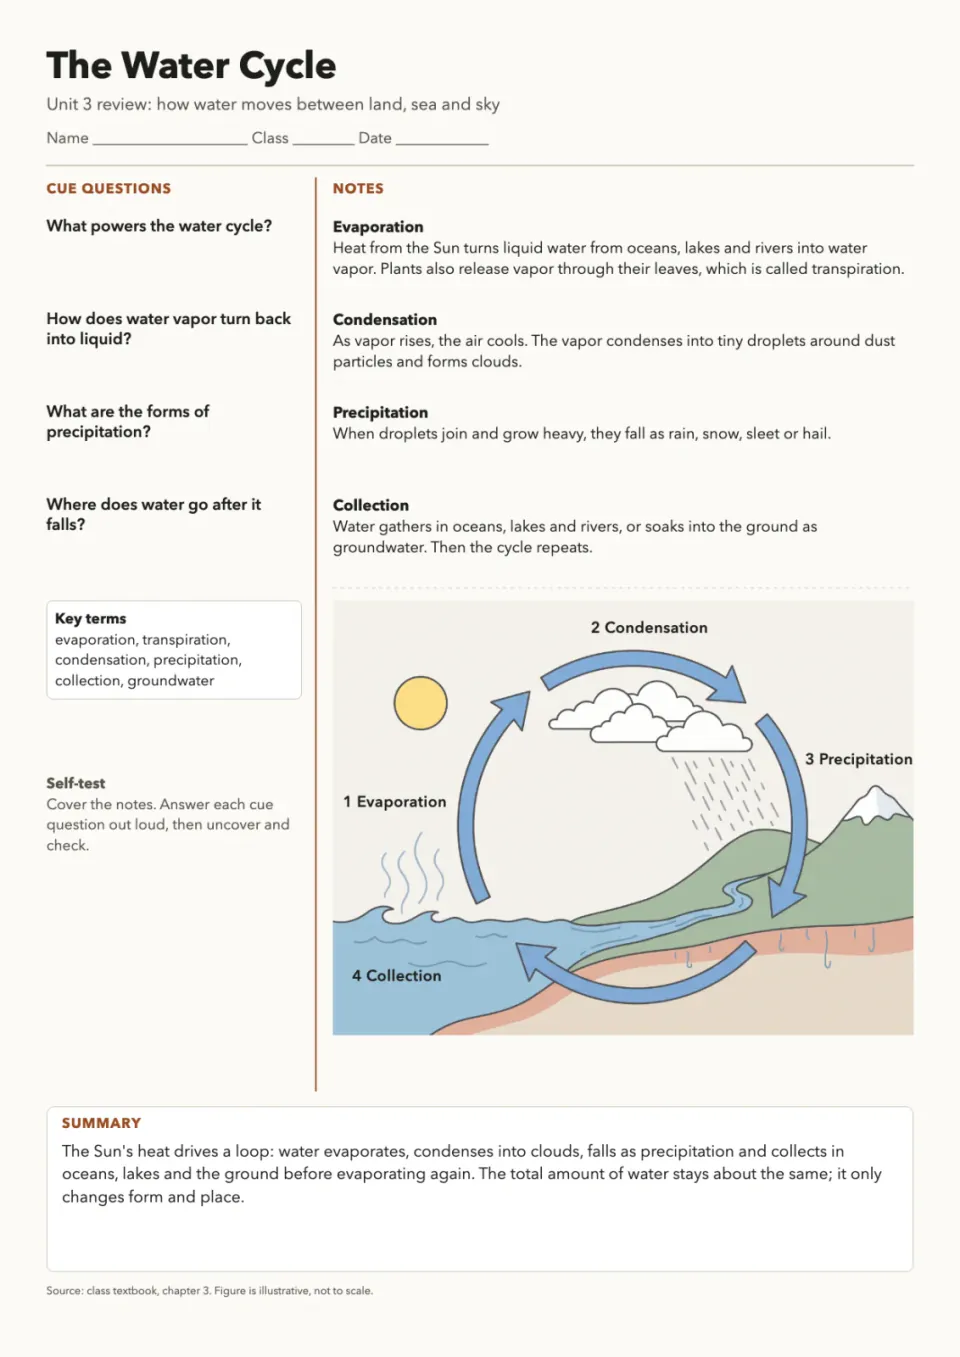
Cornell Notes Study Sheet
+25A printable two-column revision page with cue questions, notes, a drawn figure and a fill-in practice copy.
- Image
Cute Crayon Doodle Art
+25Lovably clumsy crayon characters on white paper: wobbly lines, scribbled fills, sharp files, sticker cut-outs.
 Image
Cute Mascot Avatar Maker
+25Round, two-eyed mascot avatars or chibi vinyl-toy characters, with a cut-out and a profile-size set.
 Image
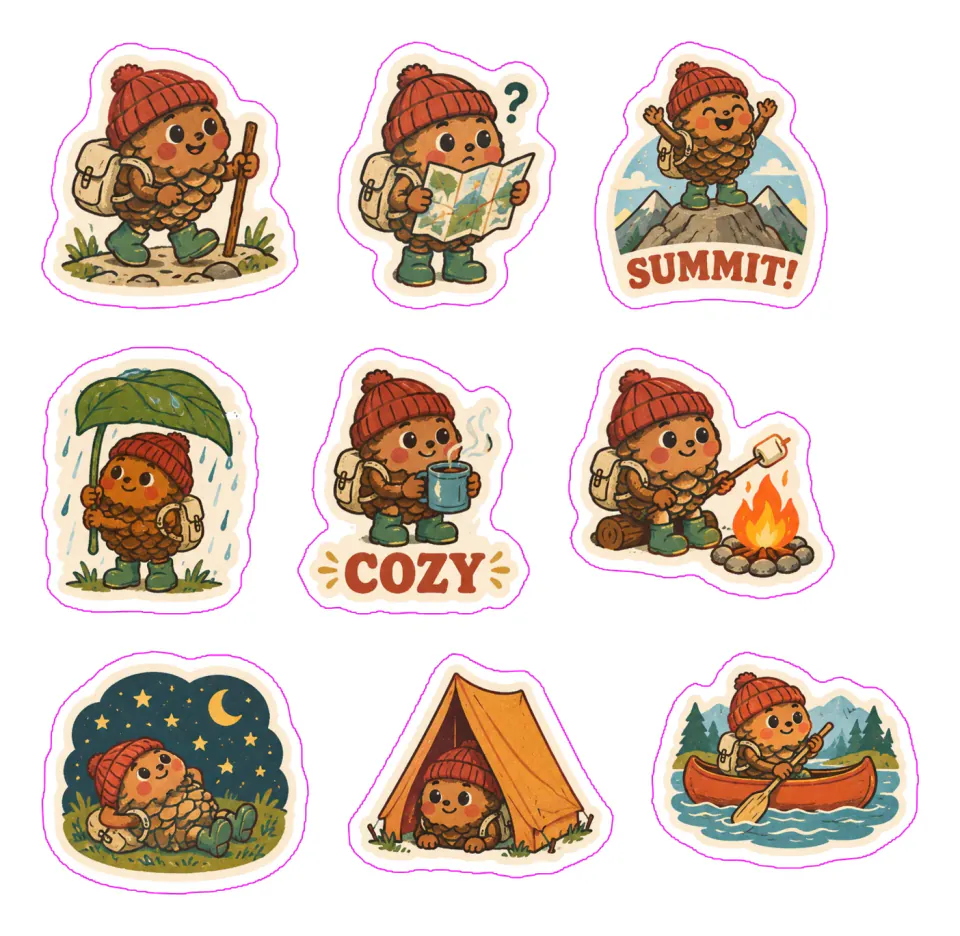
Die-Cut Sticker Sheet Maker
+258 to 24 matching stickers, cut out with white borders, on print-ready A4 or Letter sheets plus chat packs.
- Image
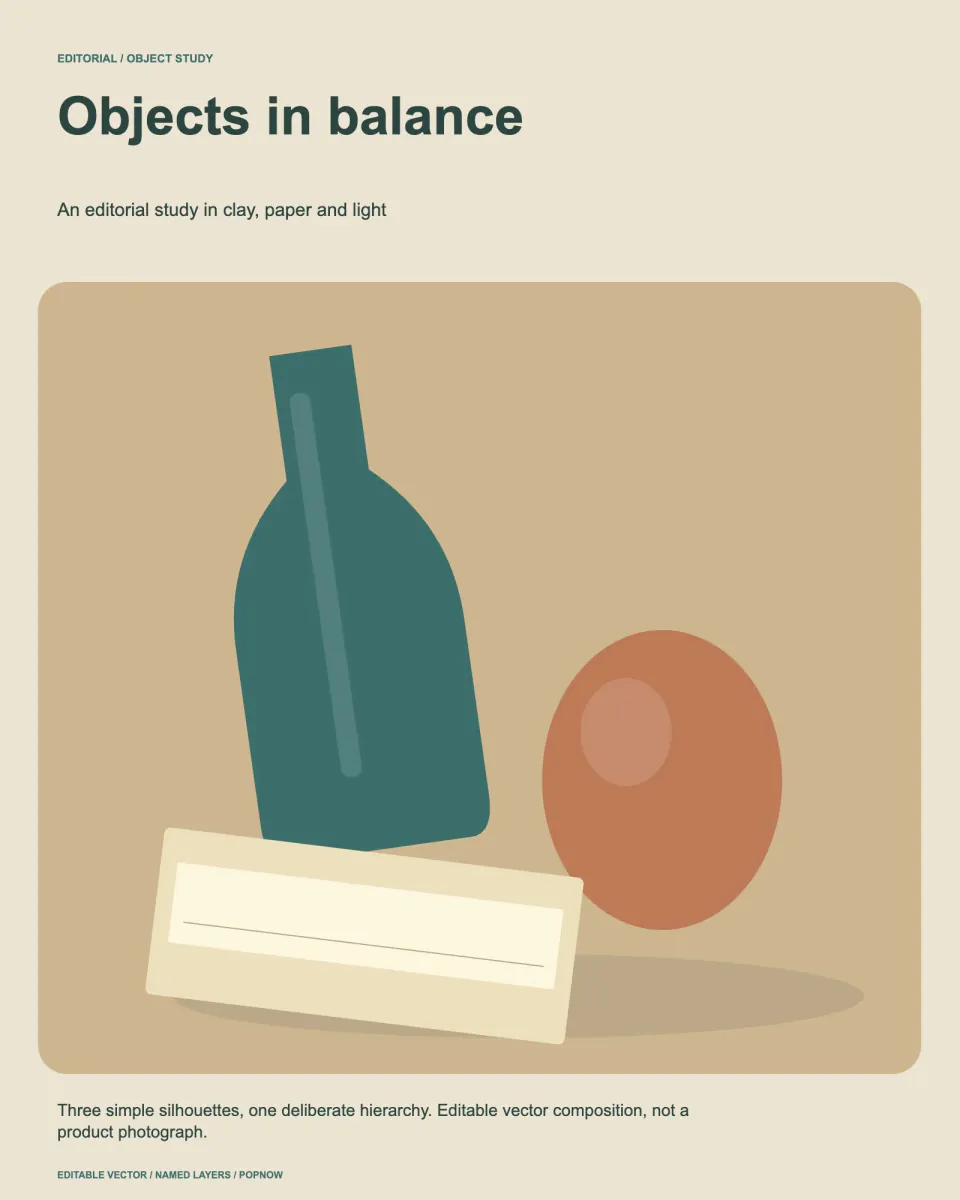
Editorial Line Illustration
+25Airy black-ink illustrations with one accent color for blog headers, newsletters and social cards.
 Image
Editorial Still Life Composition
+25Compose editable object studies with rotated-boundary checks, deliberate layering and a print-ready SVG.
- Image
Engraving Style Article Cover
+25One surreal black-ink engraving per essay: crosshatched, edge to edge, its big idea shown as a single scene.
- Image
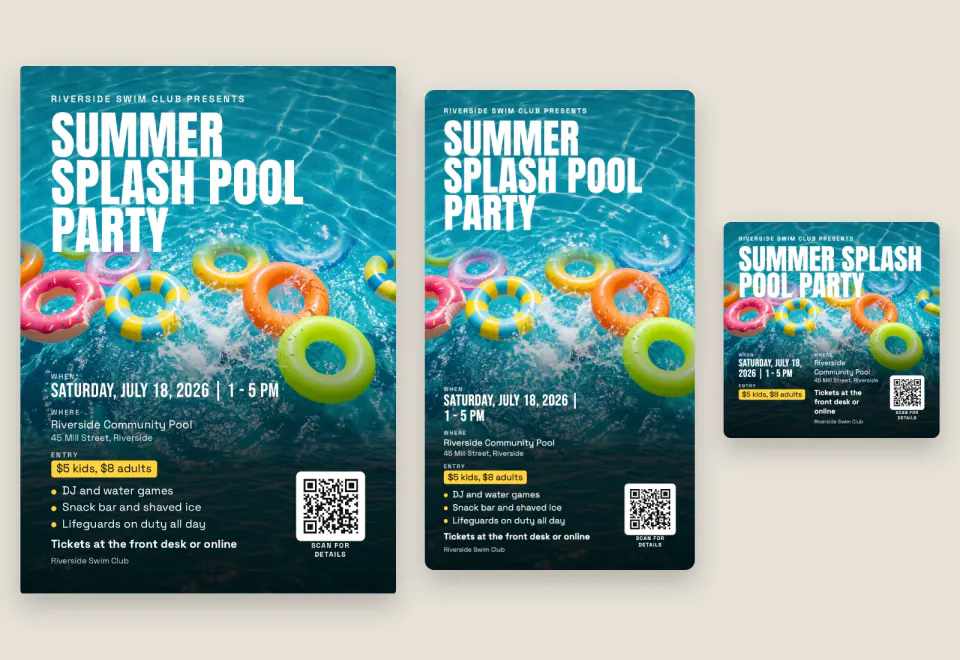
EV Platform Exploded View
+25An electric car lifted apart layer by layer: battery, motors, cabin and body in color, with callouts.
 Image
Event Flyer Maker
+25Event details in: a flyer for A4, Letter or A5 print plus square, portrait and story images, with a QR code.
- Image
Product Exploded View Poster
+25A clean exploded-view hero image of a product, with exact part labels from your spec table.
- Image
Fantasy Map Generator
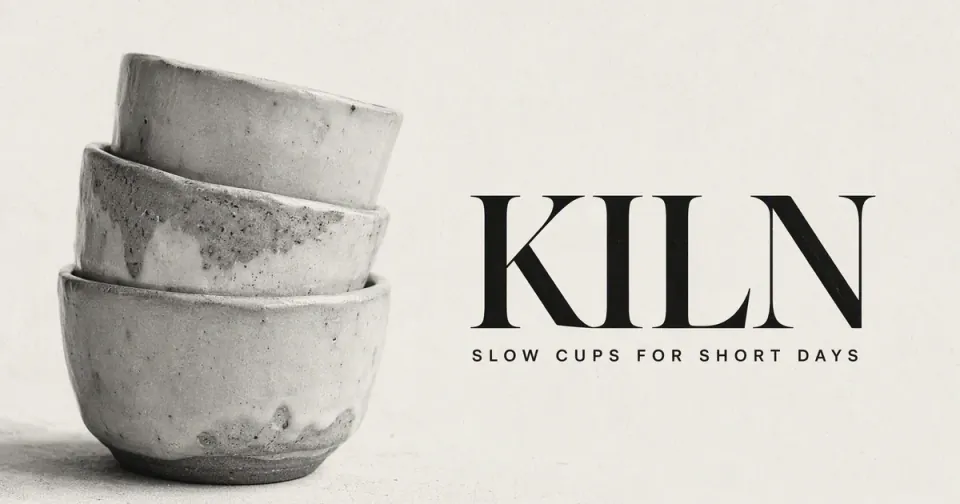
+25Parchment, atlas or black-line maps of your own world, every name lettered right, grids that line up.
 Image
Film Poster OG Image Maker
+25Quiet, poster-like link previews: black-and-white close-up, one huge black word, film grain, exact 1200x630.
 Image
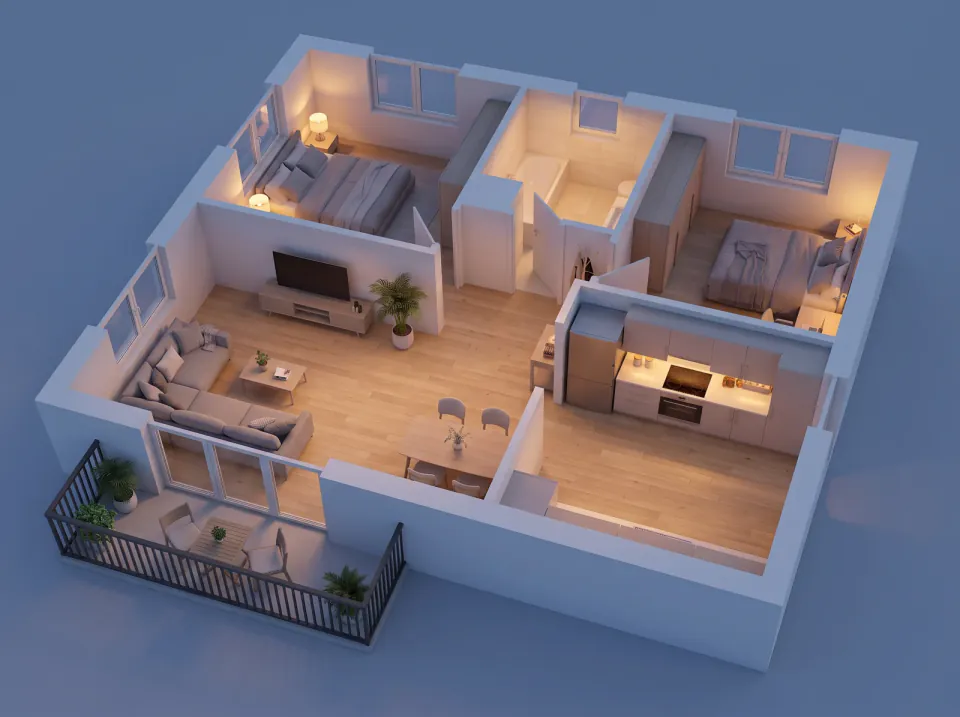
Floor Plan to 3D
+25A 2D floor plan in, a furnished 3D floor plan out: bird's-eye, angle and evening views plus a showcase page.
- Image
Regional Food Flavor Map
+25A calm painted map of regions, each with a small taste chart on one shared scale and an honest legend.
 Image
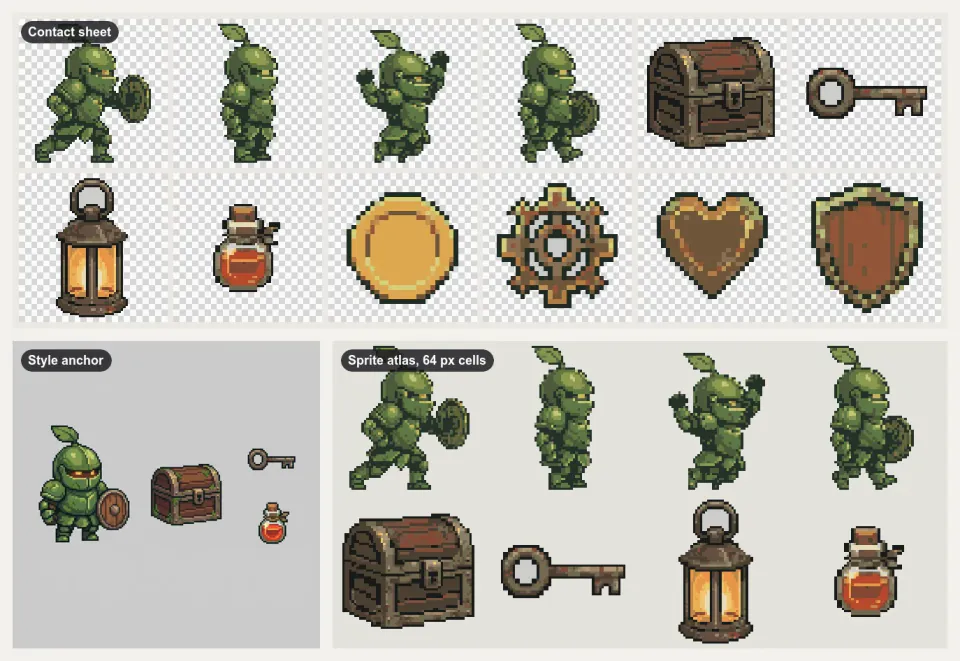
2D Game Asset Pack Maker
+25A matching 2D game art pack: posed character, tiles, props and icons, packed into sprite sheets with JSON.
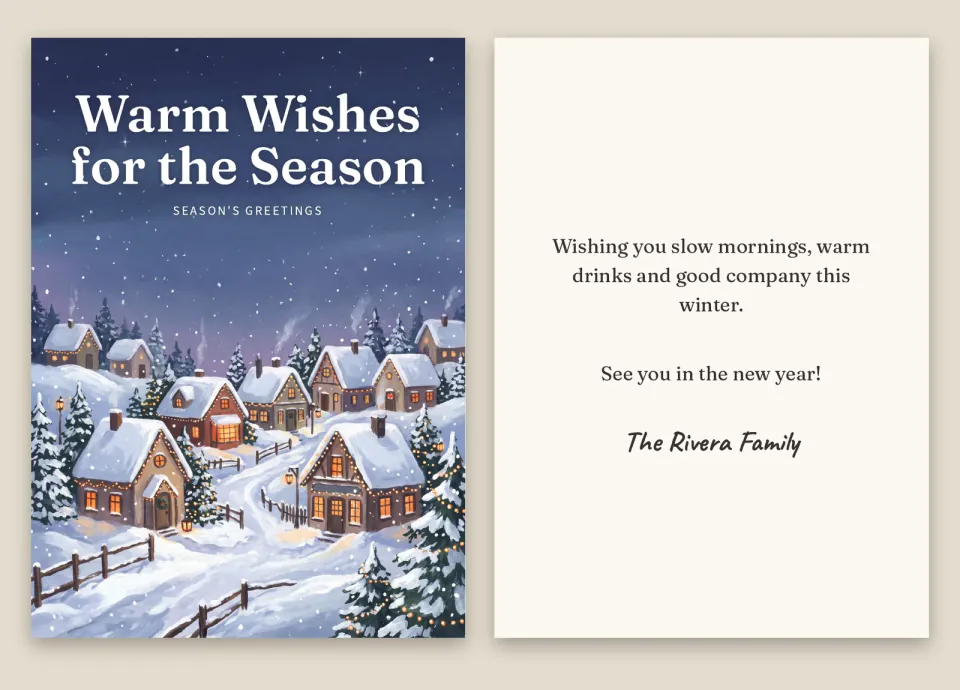 Image
Holiday Card & Invitation Maker
+25One greeting in: print-ready 5x7 cards, social and story versions, an animated e-card and an RSVP page.
- Image
Illustrated City Map Maker
+25A hand-drawn style map of a neighborhood or town, true where it matters and labeled exactly.
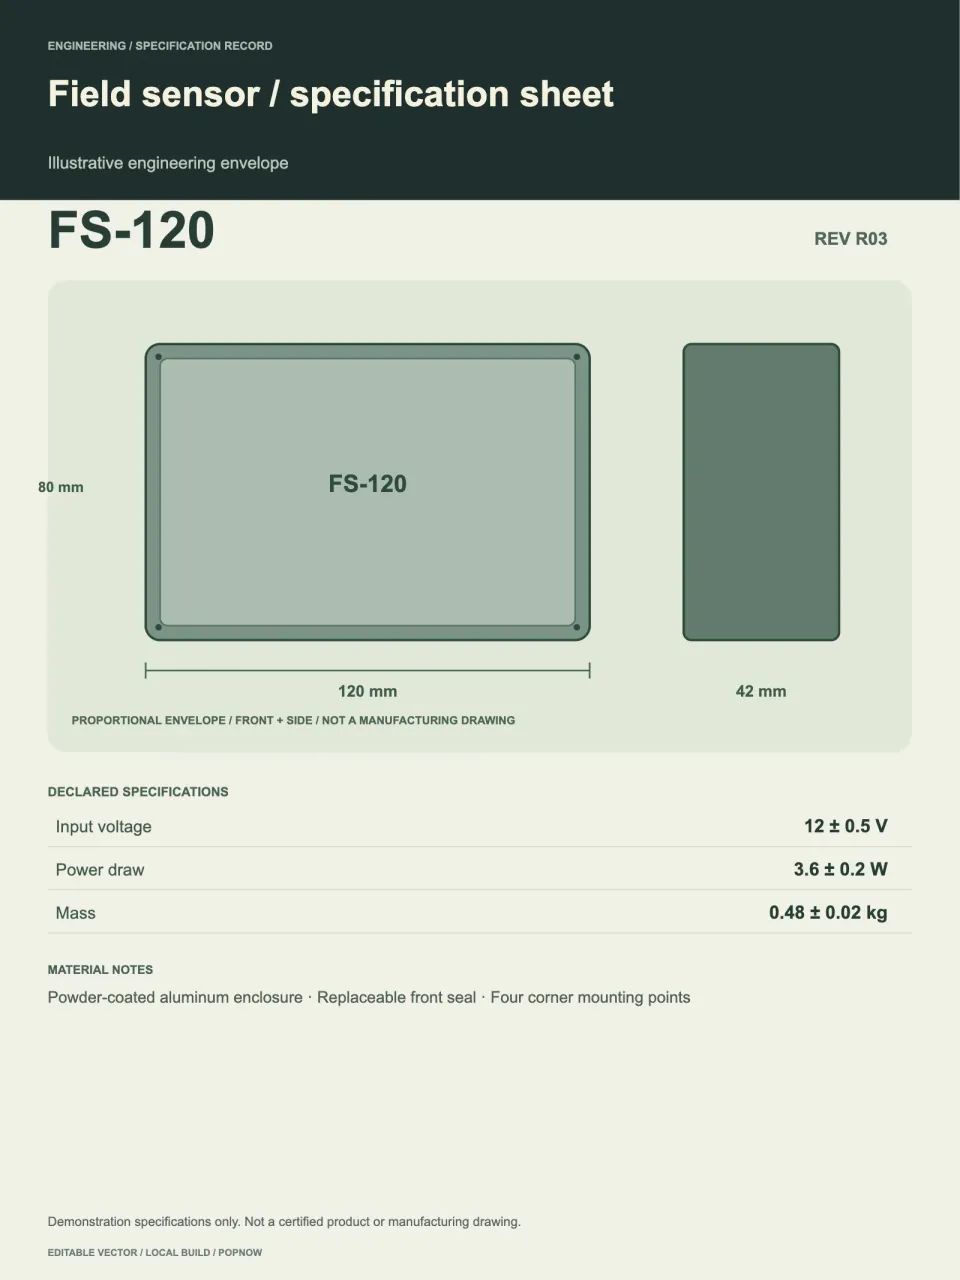 Image
Industrial Specification Poster
+25Build editable technical posters with normalized dimensions, tolerances and traceable specification tables.
- Image
Ink Sketch Storyboard
+25A rough black-ink storyboard page from a short story: open lines, white space, one beat per panel.
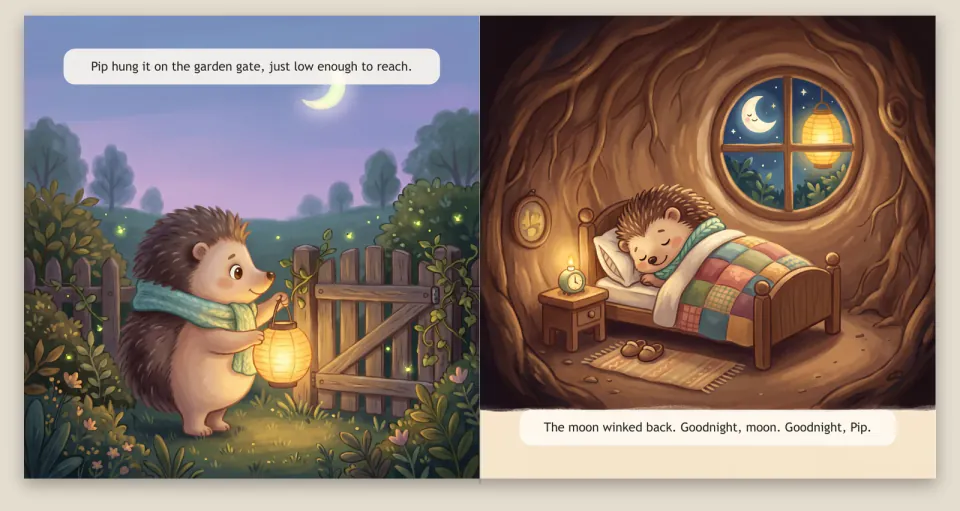 Image
Kids Picture Book Maker
+25A story idea in, a printable picture book out, with one consistent hero, a web flip-book and a bedtime video.
- Image
Line Art OG Image Maker
+25Calm link-preview images: off-white card, short black headline and a hand-drawn ink character.
 Image
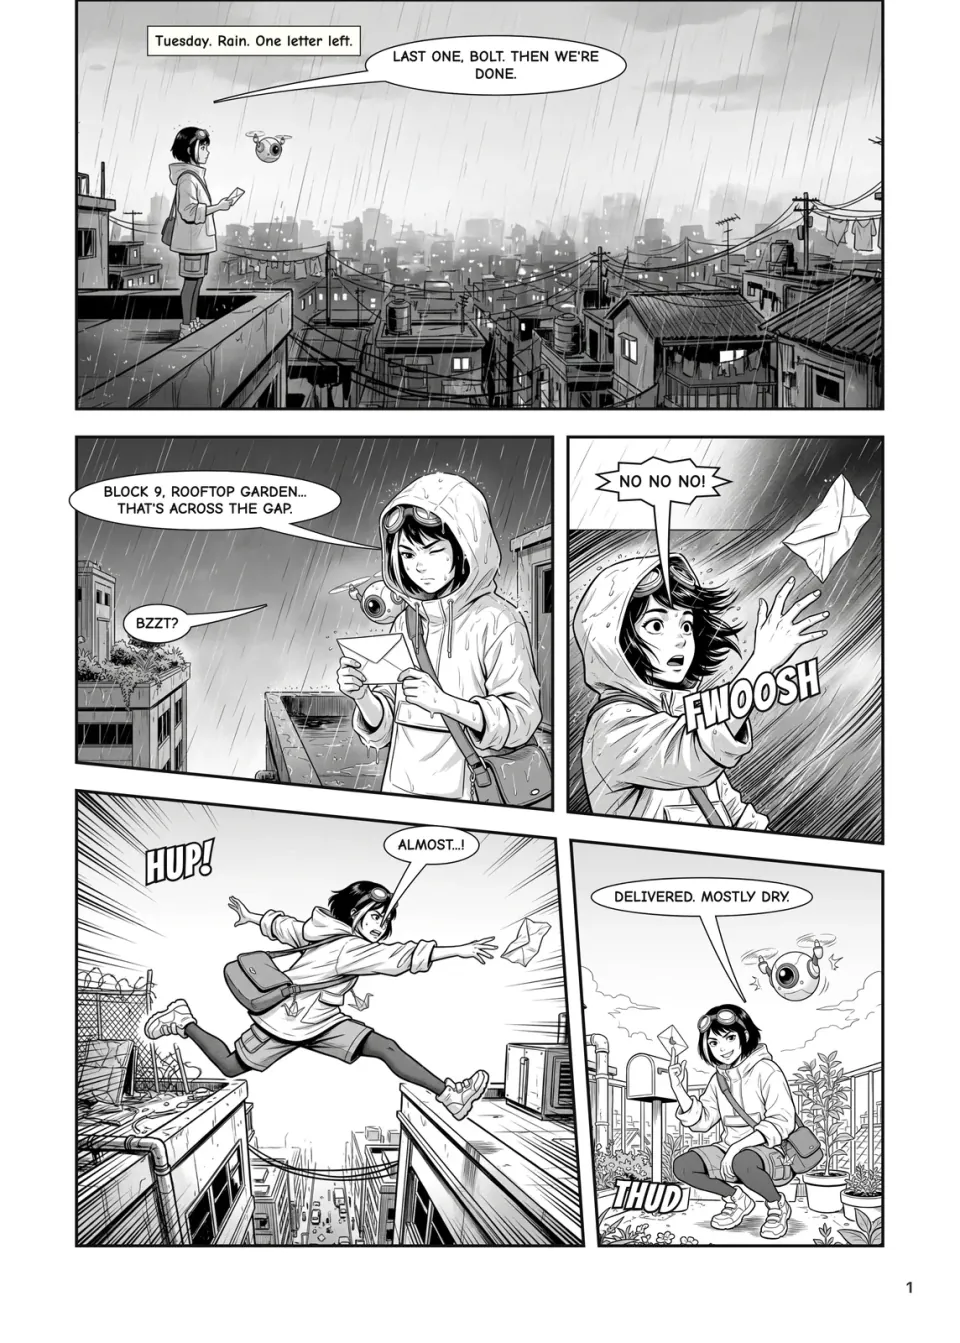
Manga Panel Maker
+25Original manga pages from your script: locked characters, real panel layouts and lettering in real fonts.
- Image
Marine Biology Research Poster
+25A wide research poster around a painted habitat cross-section, with numbered species and a findings chart.
 Image
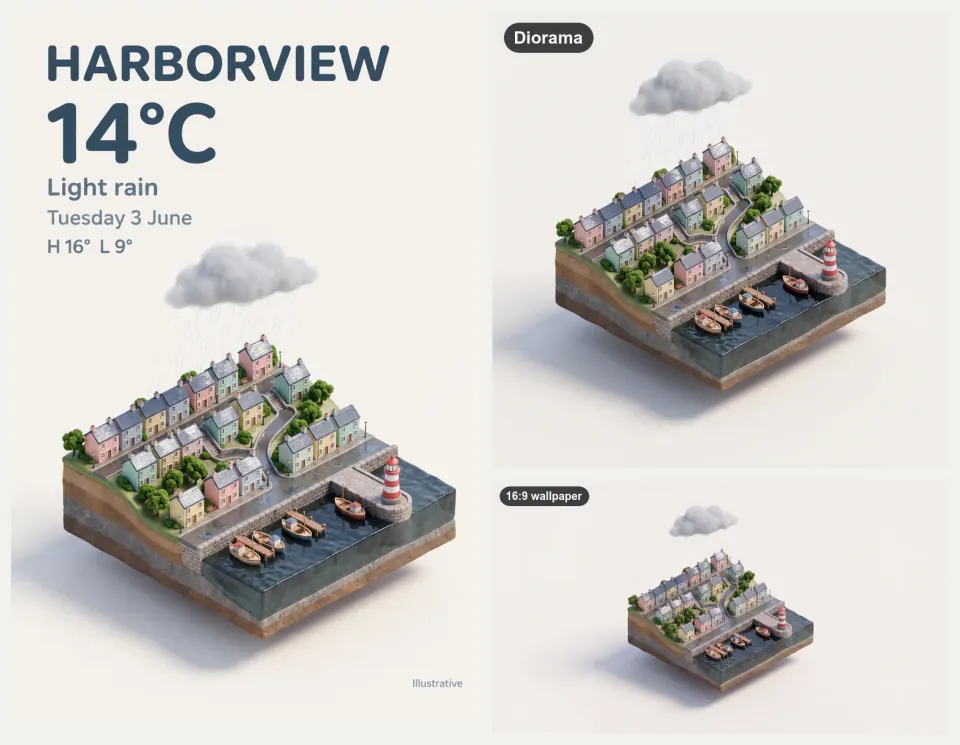
Miniature Diorama & Weather Card
+25Tiny isometric cities, rooms and tilt-shift scenes, with exact-text weather cards, a loop and 4K wallpapers.
 Image
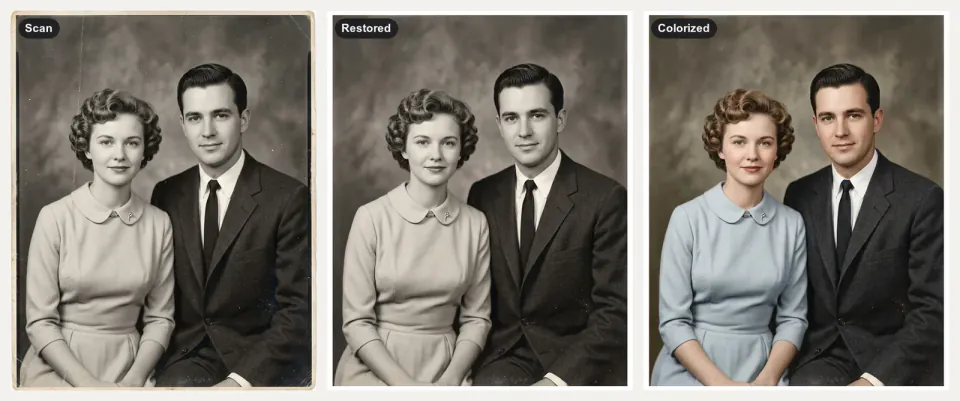
Old Photo Restoration
+25Scratched, faded family photos in, faithful restorations, color estimates and gentle living photos out.
 Image
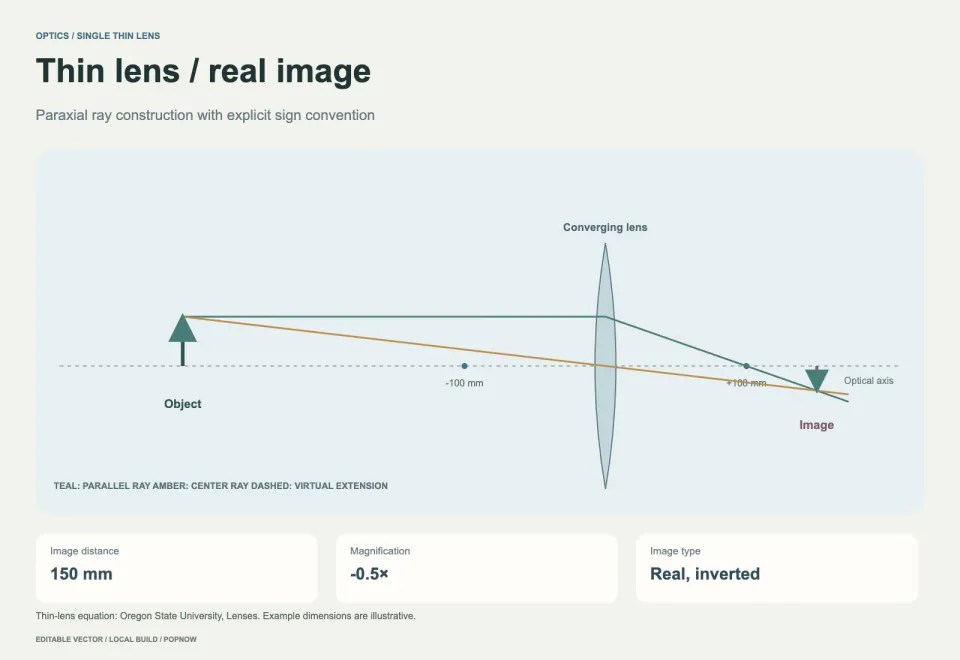
Optical Experiment Diagram
+25Draw editable thin-lens ray diagrams with calculated image distance, magnification and units.
 Image
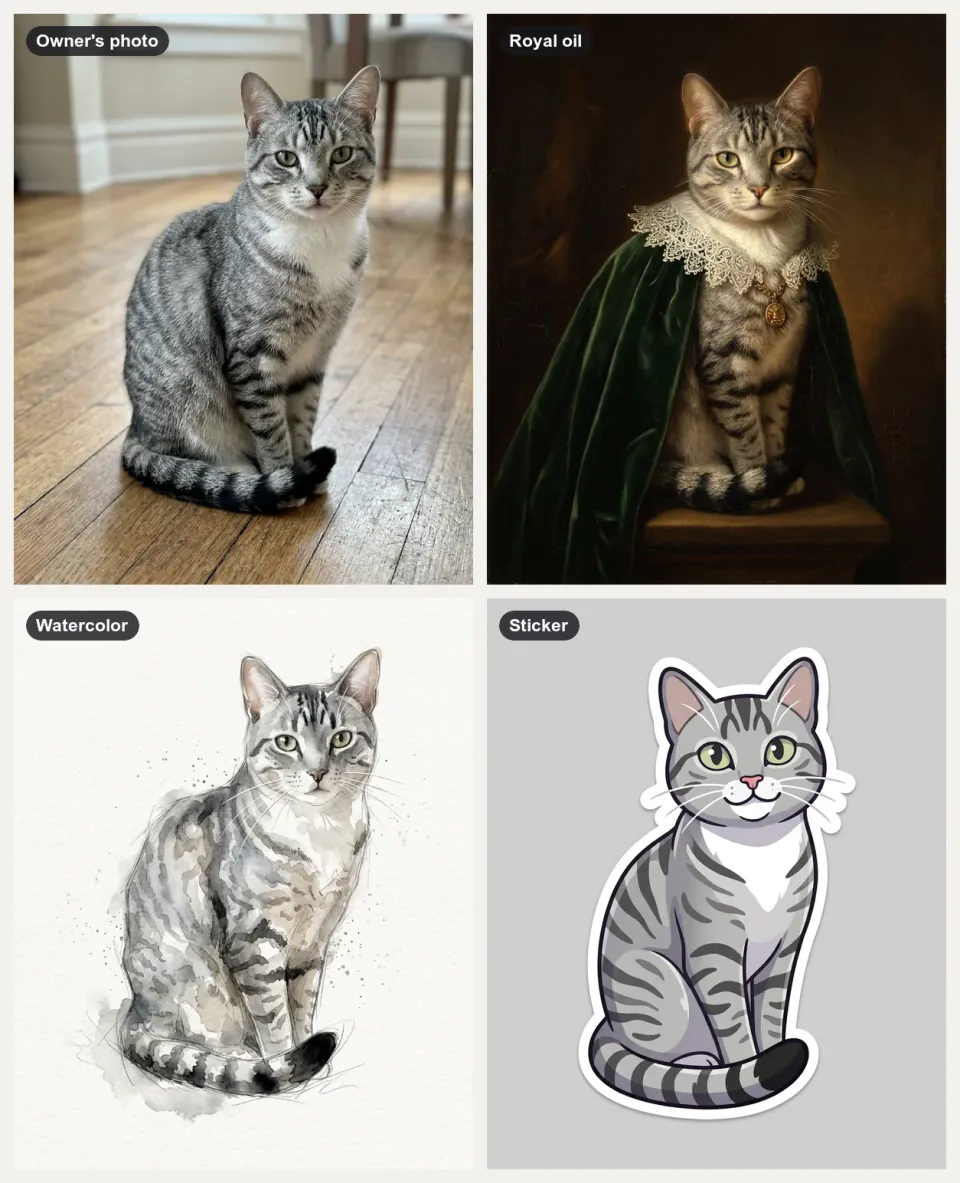
Pet Portrait Studio
+25Your pet in the styles you pick, plus a sticker, a short clip and print files, with every marking kept.
- Image
Phone Mockup Generator
+25Your app on a 3D foldable phone that swings open on a soft backdrop, as crisp PNG stills or a fold clip.
- Image
Photo Composition Studies
+25Three photographic takes on one subject, each built on a different composition principle.
 Image
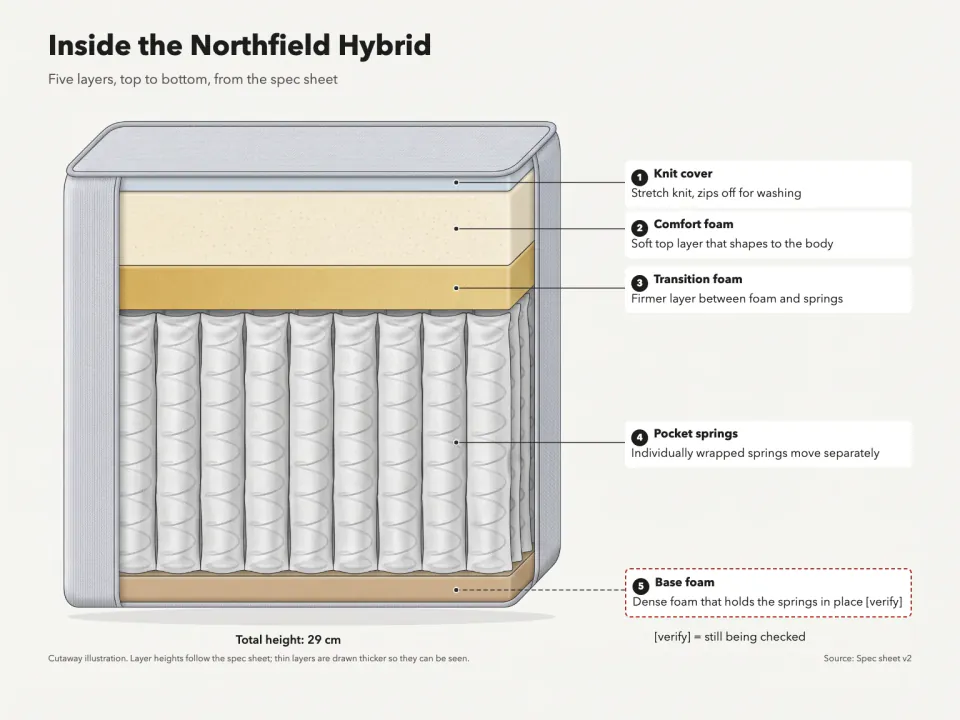
Product Cross-Section Diagram
+25A cutaway of your product showing each layer in real order, with numbered callouts from your spec sheet.
 Image
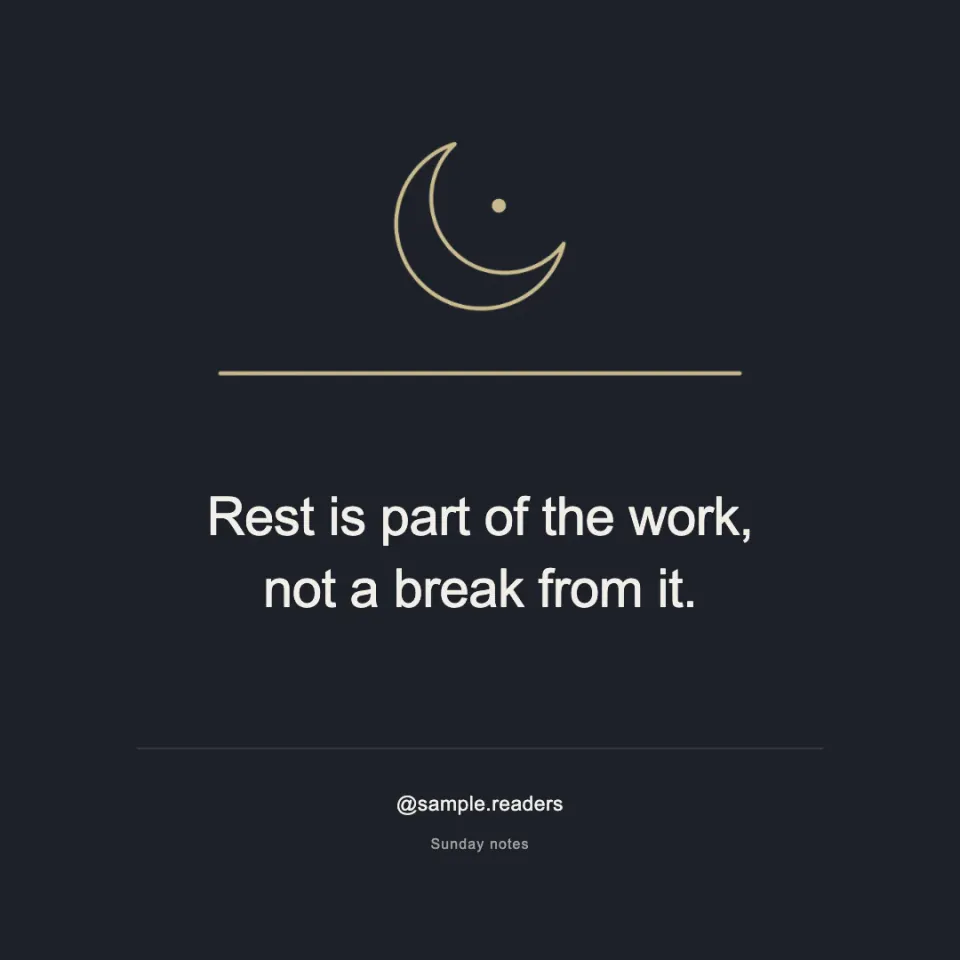
Quote Card Maker
+25Square and 4:5 quote cards with exact text, a checked credit or handle, and a line drawing of the idea.
 Image
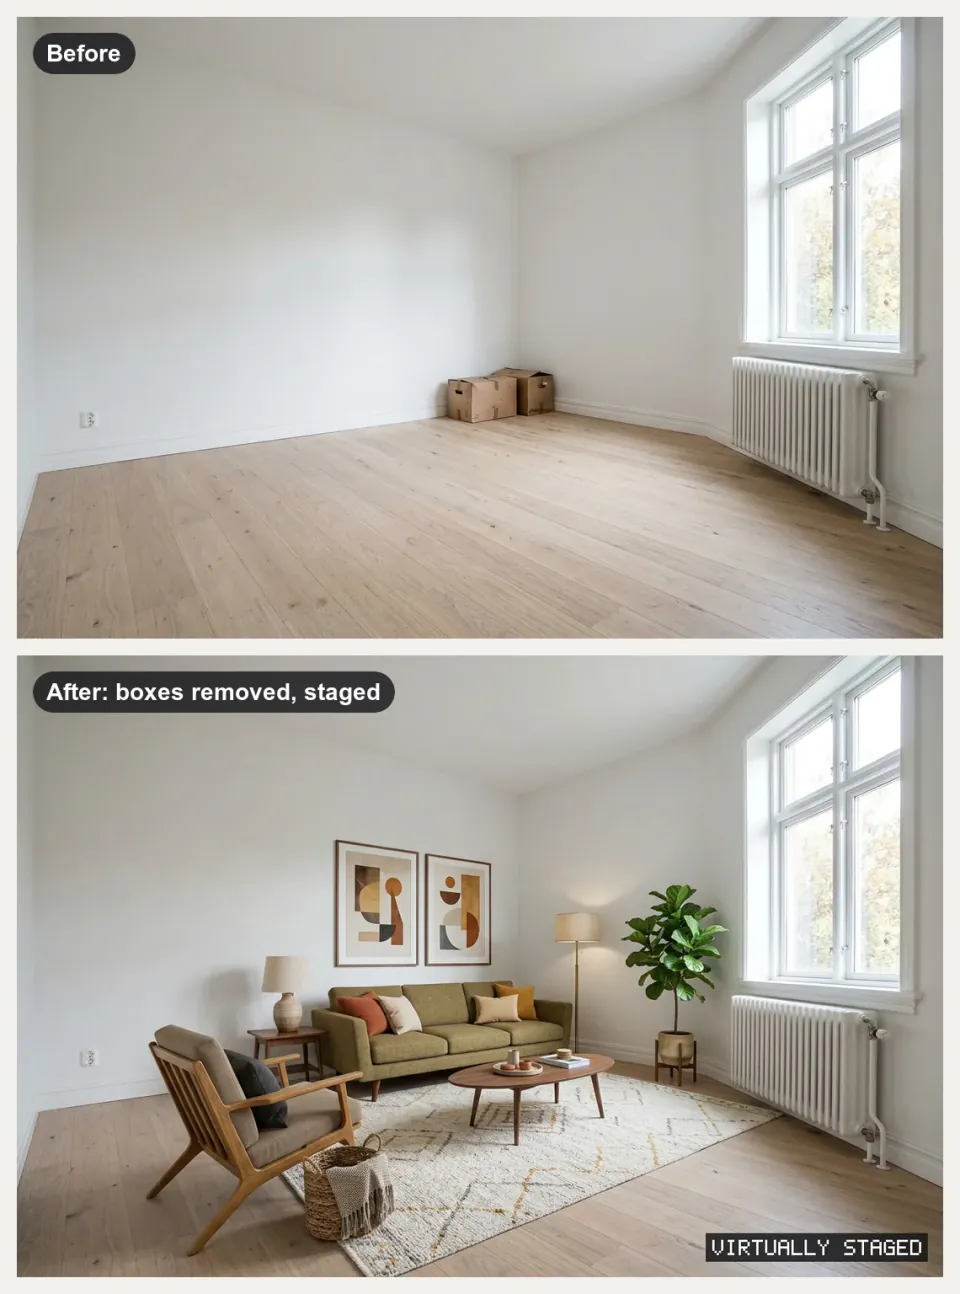
Real Estate Listing Photo Kit
+25Property photos in, cleaned and labeled listing images, staged rooms, tour clips and a listing PDF out.
- Image
Sketchnote Image Generator
+25Turns an article or notes into one hand-drawn 4:3 sketchnote with exact, checked labels.
 Image
Skincare Science Diagram
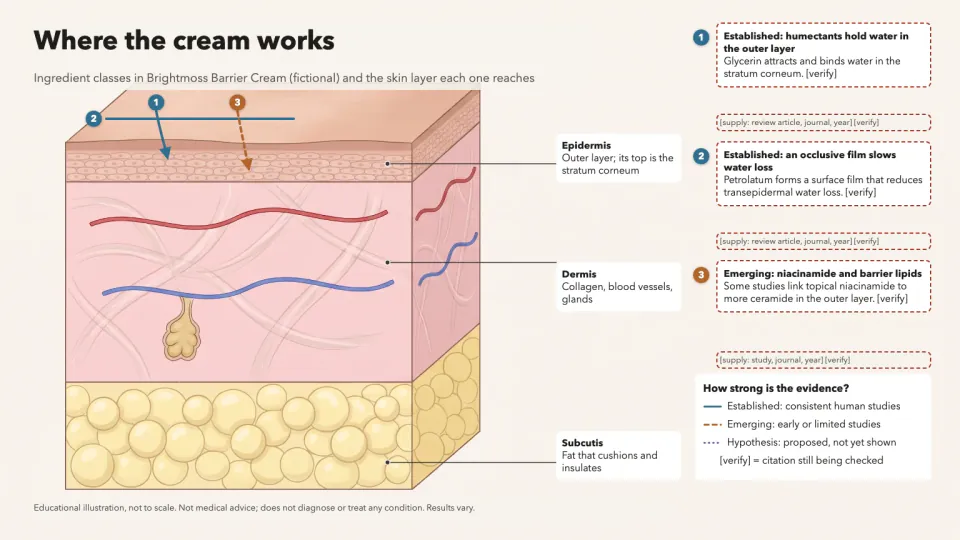
+25A skin layer diagram showing where ingredients act, with evidence-styled arrows and a source on every claim.
- Image
Social Cover & Thumbnail Generator
+25One message in, a checked set of OG images, post covers and video thumbnails out, every size exact.
 Image
Trading Card Maker
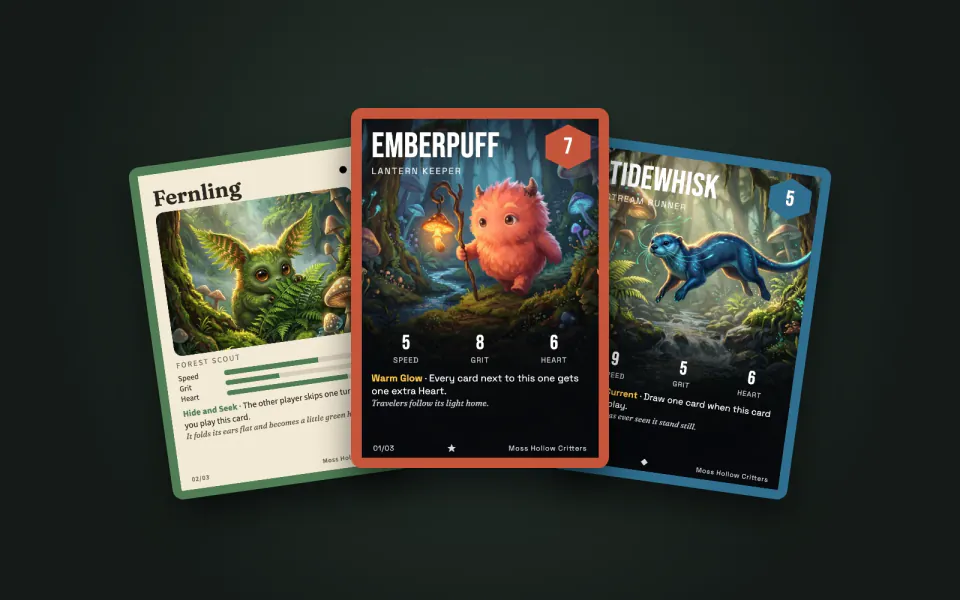
+25A spreadsheet of names and stats in: a matching set of original cards, print-ready at 63 x 88 mm.
 Image
T-Shirt Design Generator
+25Original shirt designs as print-ready transparent PNGs at 300 DPI, plus flat-lay and on-model mockups.
 Image
Watercolor Concept Diagram
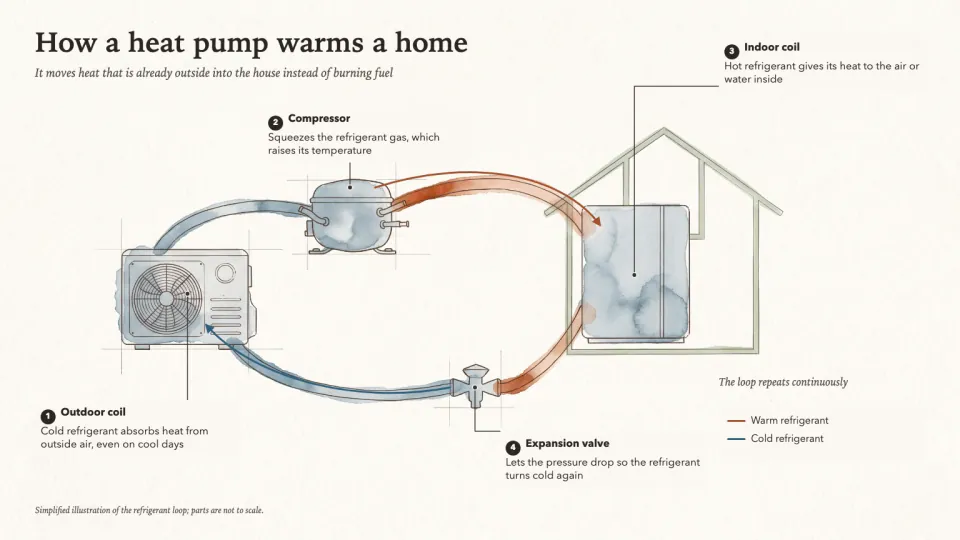
+25A watercolor illustration of how something works, with fine ink lines, clean label lanes and exact callouts.
 Image
Wedding Invitation Suite
+25One set of wedding details in: invitation, RSVP, details, menu, place cards, sign and e-invites that match.


Questions
What input is required?
A research question, two to four method steps, two to five measured groups with values, units and sources, a supported finding and a limitation.
What is actually validated?
Validate finite measurements, identical comparison units, unique group labels and complete source notes. Plot a shared zero-baseline chart and keep the research question, method, observed result and limitation separate.
Can I edit the result?
Yes. The SVG contains text and named vector groups. You can also edit the JSON and rebuild all outputs with the bundled Python script.
Does this require paid generation?
No. The local vector version is complete without a key. Optional PopNow imagery requires a live quote and explicit API USD budget approval.