
What you get
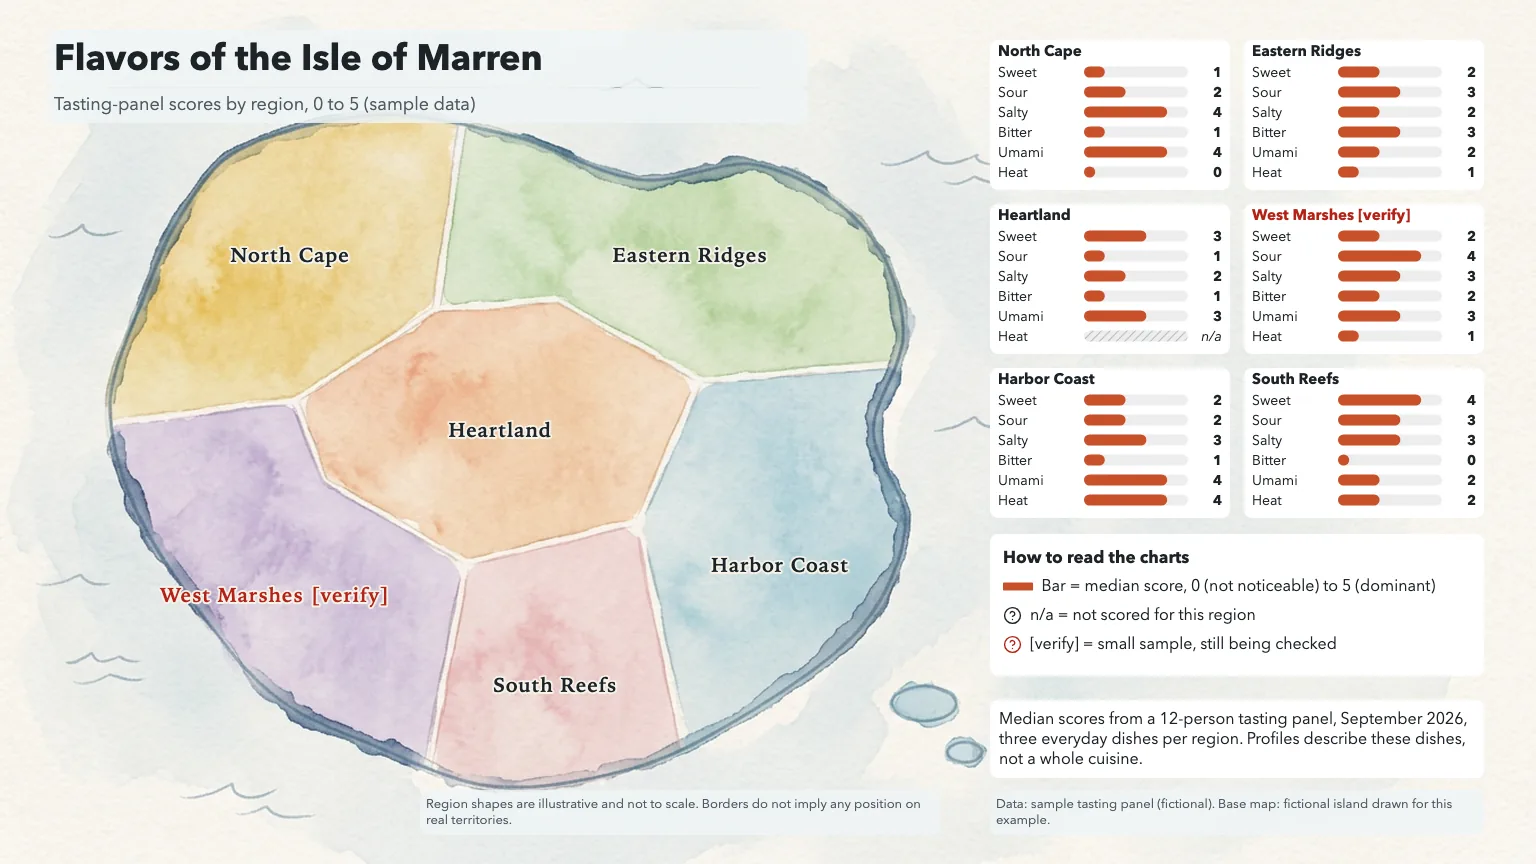
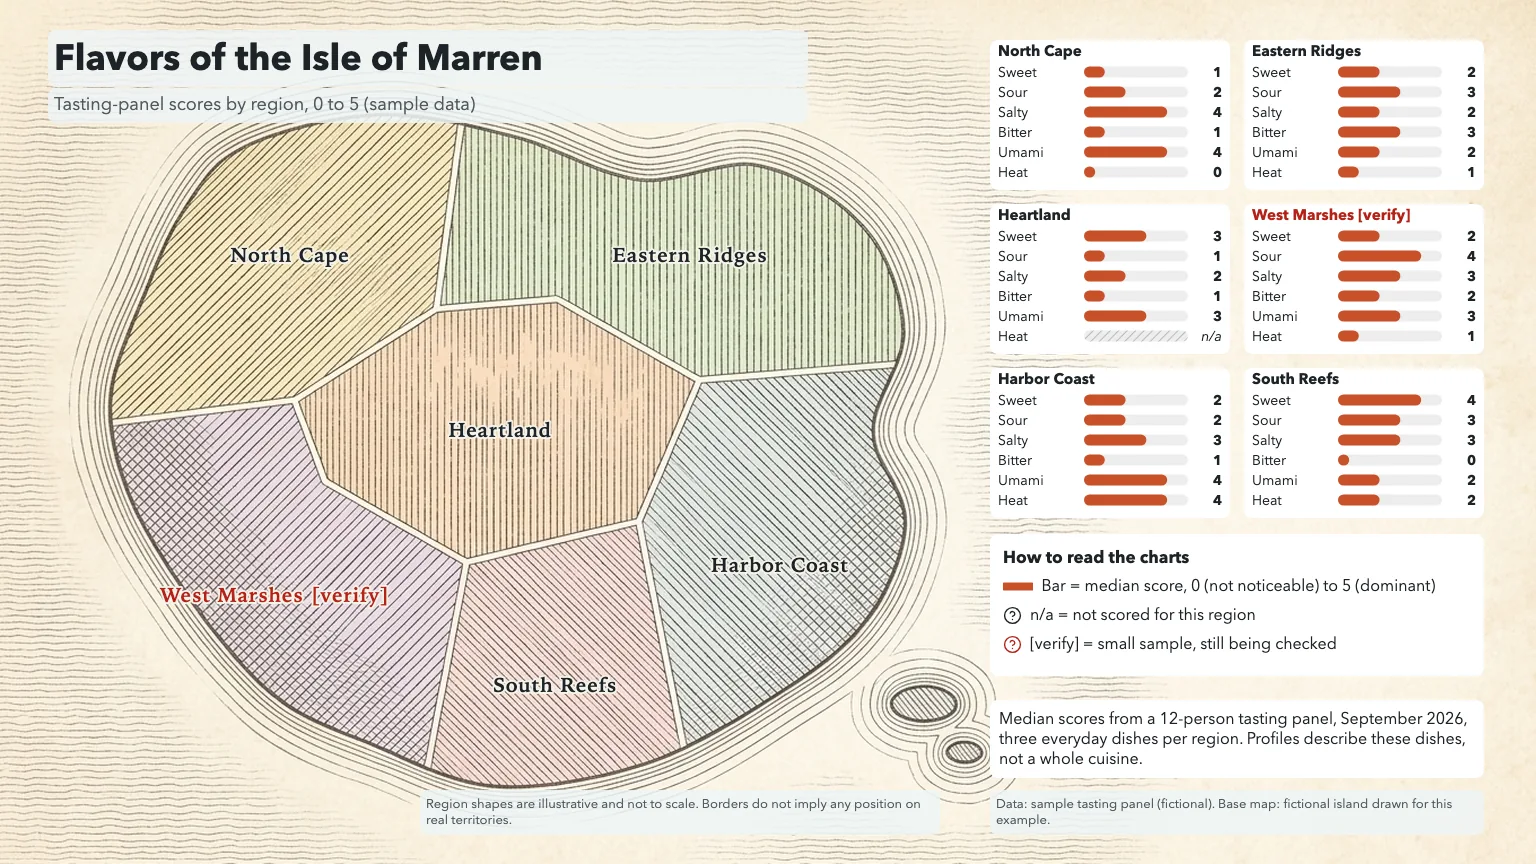
- Three 16:9 illustrated base maps of your regions in different looks
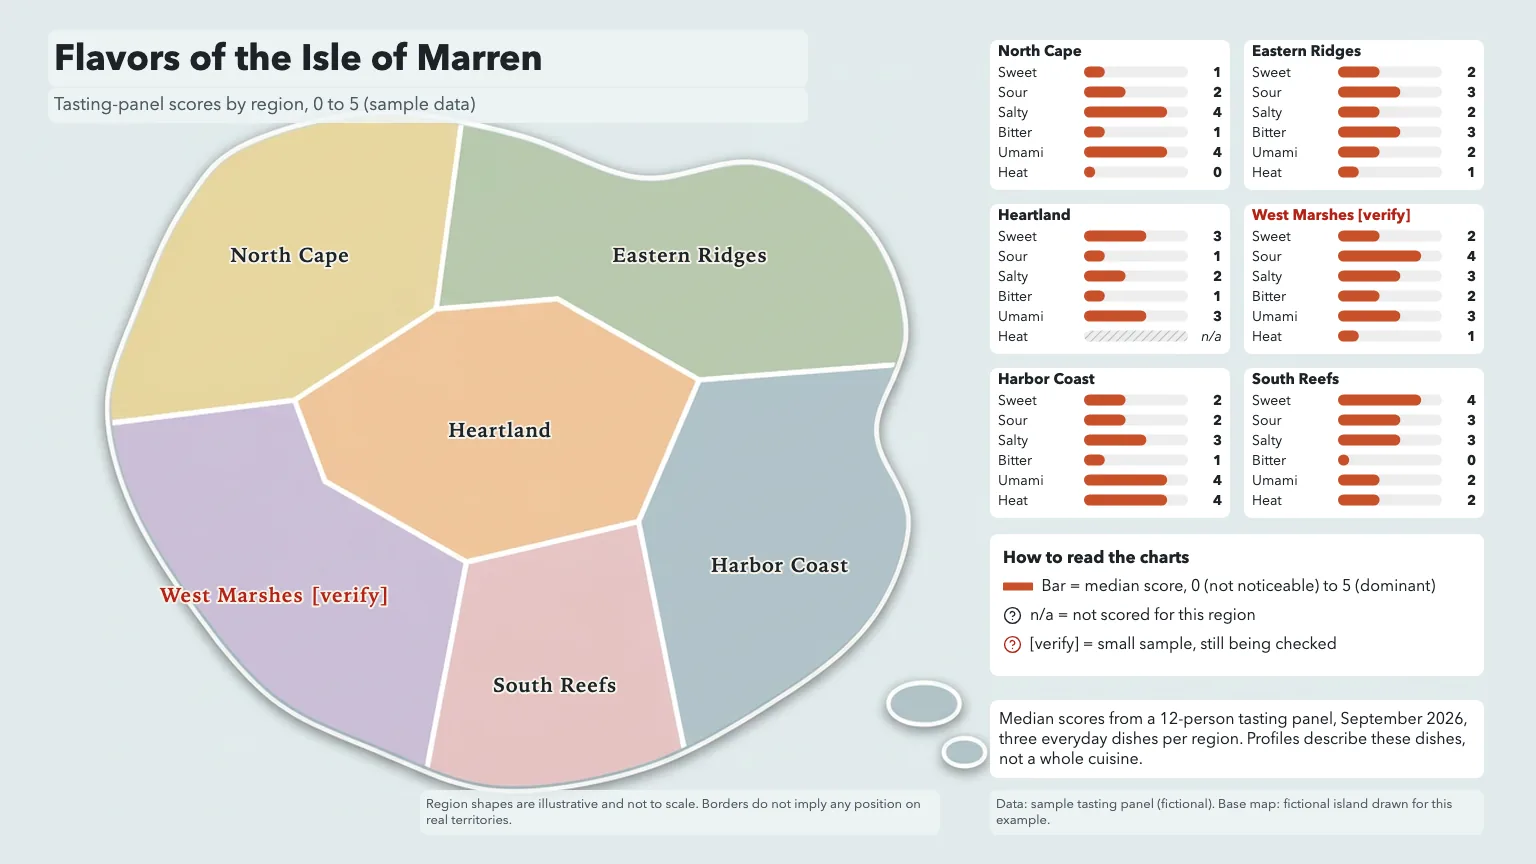
- Labeled maps with region names, shared-scale charts, legend and method note (HTML, PNG, PDF)
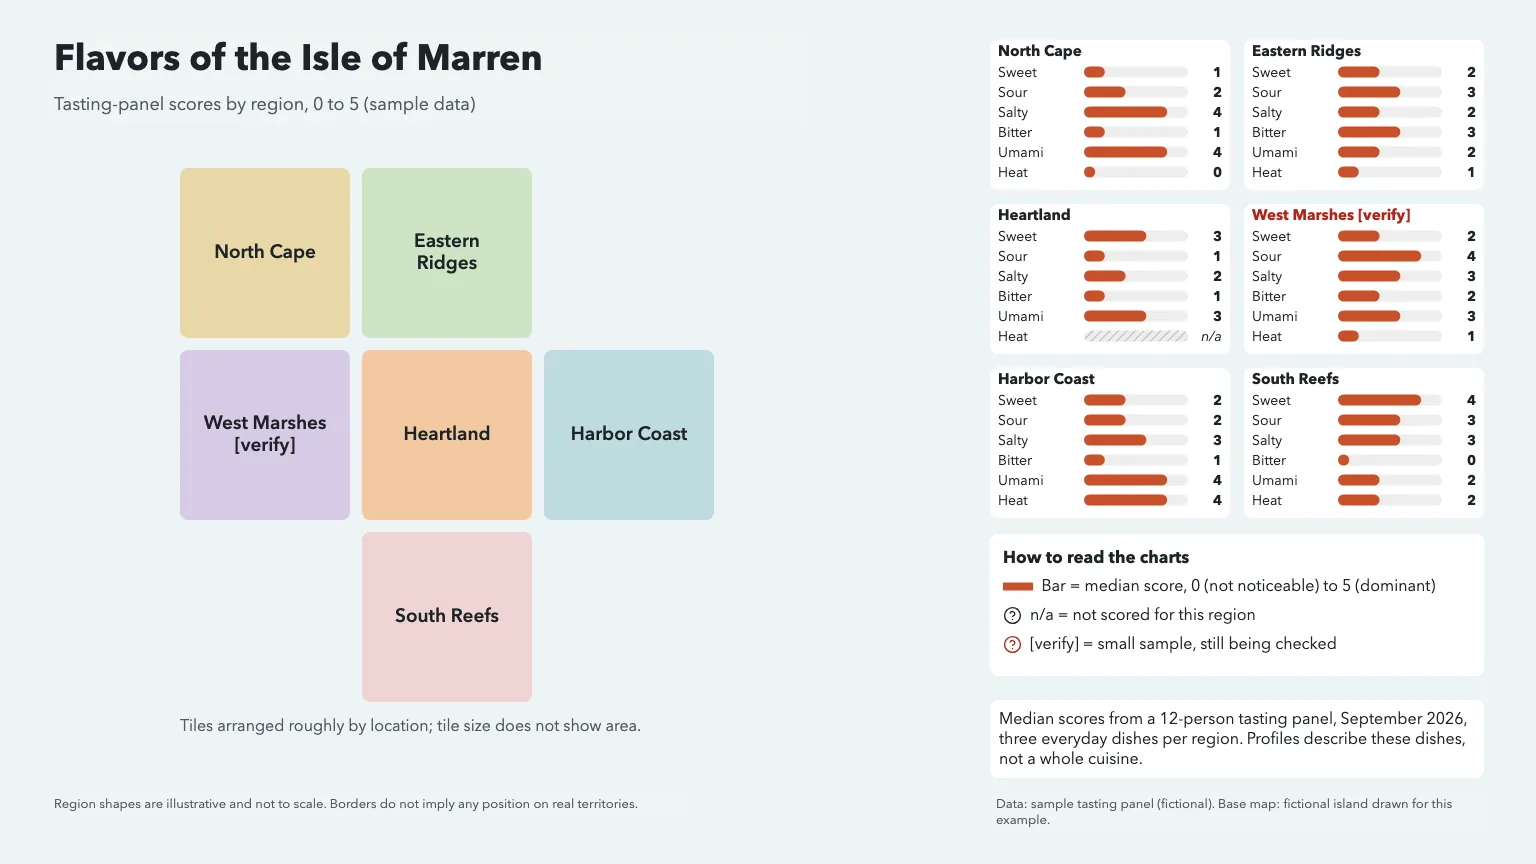
- A free tile-map version that needs no image generation
- The normalized data table with sources and open questions
Good for
- Food, coffee, tea, wine and spice guides by region
- Travel and culinary articles, menus and tasting handouts
- Teaching geography and food culture with sourced data
Not for
- Maps where borders or distances must be exact
- Turning reputations or stereotypes into data
- Statements about disputed territory
How to use it
In Claude or ChatGPT
Use the PopNow skill "Regional Food Flavor Map" (food-flavor-map) for this: A flavor map of the six regions in our tasting-panel results, sweet to heat on a 0 to 5 scale, for the festival booklet.
In a coding agent
/popnow-food-flavor-map A flavor map of the six regions in our tasting-panel results, sweet to heat on a 0 to 5 scale, for the festival booklet.
Then try
Add a small generic dish vignette next to each chart.
Make the tile-map version for the slide deck.
What to have ready
- Your regions and approved base geography (or choose tiles)
- Scores on shared axes with method, date and sources
- A PopNow API key for the illustrated map (tiles are free)
Similar skills
View all →Black and White Studio Portrait
+3Turn an everyday photo into a calm black-and-white studio portrait that still looks like you.
Blog Post Illustration Set
+3Three matching illustrations for one article, each showing what its passage actually says.
Brand Kit & DESIGN.md Generator
+3A brand kit from a short brief: checked palette, open fonts, SVG logo, mockups and a DESIGN.md agents follow.
Car Cutaway Anatomy Poster
+3A side-view cutaway of a generic car: color-coded systems, numbered markers and round zoom windows.
Chalkboard Infographic Maker
+3A 16:9 chalkboard-style infographic with exact short copy, chalk drawings and one clear reading path.
Cinematic Storyboard Frames
+3Three storyboard contact sheets for one scene, each a different way to shoot it, with continuity kept.
Consistent Concept Art Set
+3A character, a prop and an environment that clearly belong to the same fictional world.
Cute Crayon Doodle Art
+3Lovably clumsy crayon characters on white paper: wobbly lines, scribbled fills, sharp files, sticker cut-outs.
Editorial Line Illustration
+3Airy black-ink illustrations with one accent color for blog headers, newsletters and social cards.
Engraving Style Article Cover
+3One surreal black-ink engraving per essay: crosshatched, edge to edge, its big idea shown as a single scene.
EV Platform Exploded View
+3An electric car lifted apart layer by layer: battery, motors, cabin and body in color, with callouts.
Product Exploded View Poster
+3A clean exploded-view hero image of a product, with exact part labels from your spec table.
Fantasy Map Generator
+3Parchment, atlas or black-line maps of your own world, every name lettered right, grids that line up.
Illustrated City Map Maker
+3A hand-drawn style map of a neighborhood or town, true where it matters and labeled exactly.
Ink Sketch Storyboard
+3A rough black-ink storyboard page from a short story: open lines, white space, one beat per panel.
Line Art OG Image Maker
+3Calm link-preview images: off-white card, short black headline and a hand-drawn ink character.
Marine Biology Research Poster
+3A wide research poster around a painted habitat cross-section, with numbered species and a findings chart.
Phone Mockup Generator
+3Your app on a 3D foldable phone that swings open on a soft backdrop, as crisp PNG stills or a fold clip.
Photo Composition Studies
+3Three photographic takes on one subject, each built on a different composition principle.
Sketchnote Image Generator
+3Turns an article or notes into one hand-drawn 4:3 sketchnote with exact, checked labels.
Social Cover & Thumbnail Generator
+3One message in, a checked set of OG images, post covers and video thumbnails out, every size exact.
Questions
Will the image model draw the borders?
No. You approve the geography first and the model only restyles it. Sensitive borders get a neutral note, or you use the tile map, which has no borders at all.
How are the flavor charts made?
They are drawn from your table, not generated. Every chart uses the same axes and scale, values are printed, and missing scores show as no data instead of zero.
Can I map coffee origins or wine regions instead of dishes?
Yes. Any regional profile works as long as every region was measured on the same axes with the same method, and the method is stated on the map.
What does it cost?
Three PopNow image tasks for the illustrated base maps, quoted together first. The tile map, charts, labels and exports are free.