


What you get
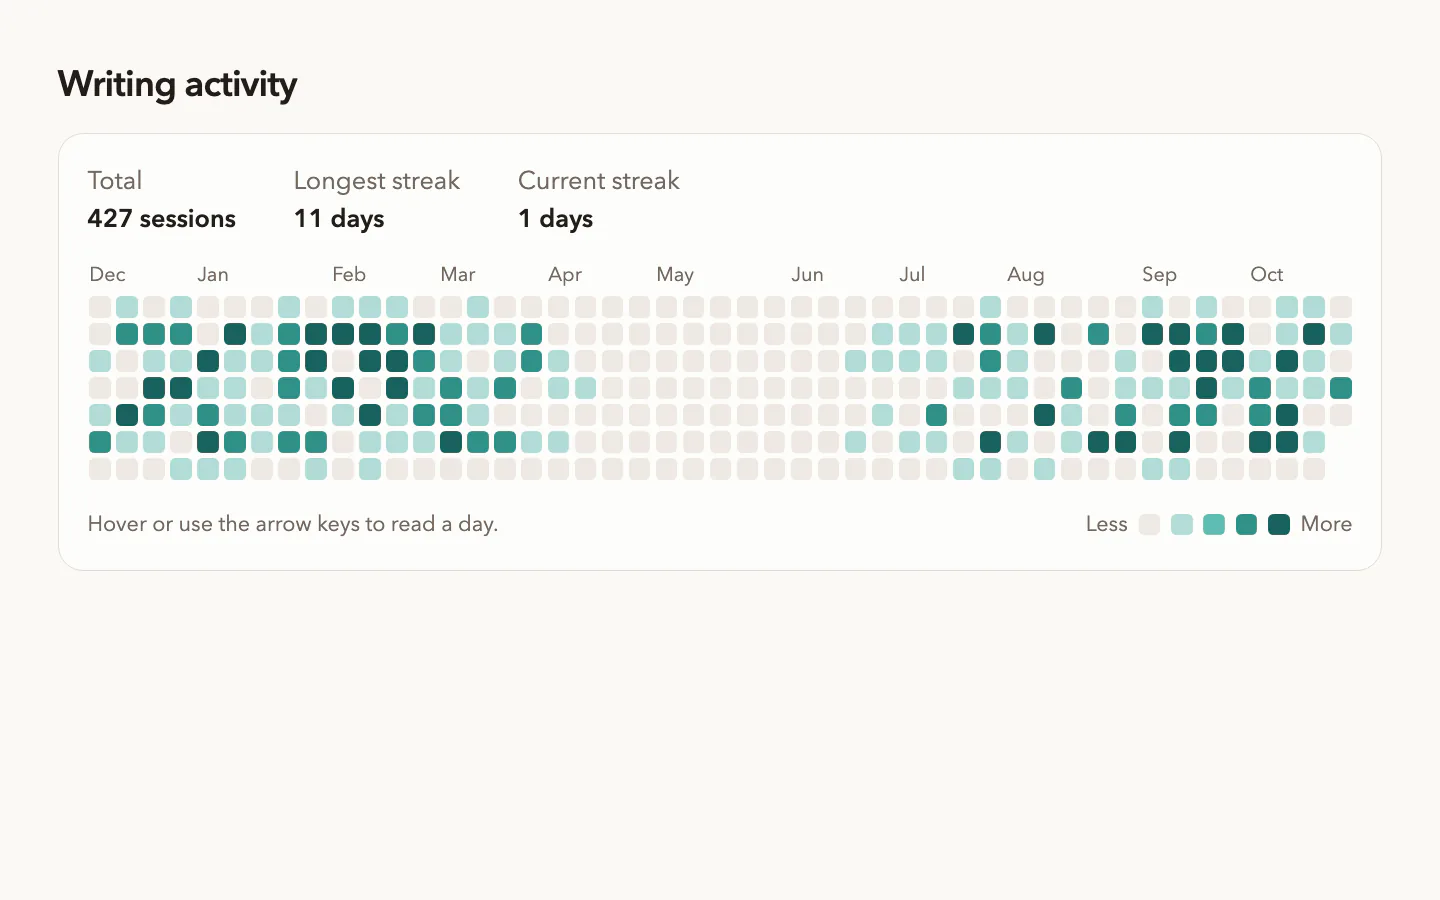
- A dependency-free React heatmap component with typed props
- The same calendar as one HTML file with a JSON data block
- A script that aggregates git log, CSV or JSON into daily counts
- Totals, streaks, keyboard navigation and a live readout
- Optional header or share-card art from PopNow, quoted first
Good for
- Commit, writing or study history on a profile page
- Habit, workout and streak trackers
- Daily sales, sign-ups or ticket volume in a report
Not for
- Comparing several series on one chart
- Hour-of-day patterns or very short histories
- Looking up exact values, where a table reads better
How to use it
In Claude or ChatGPT
Use the PopNow skill "Calendar Heatmap" (activity-heatmap-calendar) for this: Show my commits from this repo over the past year on my portfolio's About page.
In a coding agent
/popnow-activity-heatmap-calendar Show my commits from this repo over the past year on my portfolio's About page.
Then try
Use fixed levels: 1, 3 and 6 commits.
Make a share card background for this section and tell me the credits first.
What to have ready
- Your records or the command that exports them
- What one unit means, such as a commit or an order
- The date range and whether Monday starts the week
Similar skills
View all →3D Avatar Maker
+3Build a cute soft-toy 3D character in your browser and save it as a transparent PNG or a 3D page.
AI SaaS Landing Page
+3Warm sand paper, hairline rails and hatched gutters around a live kanban board where an assistant plans tasks.
Animated Hero Section
+3A landing-page hero with a gently rotating headline word, two buttons and a wide image frame.
Shader Hero Agency Website
+3A live orange-heat shader hero behind a bottom-pinned statement, pill nav and a staggered case-study grid.
Dark SaaS Landing Page
+3A dark, motion-rich marketing site for a software product, delivered as one self-contained HTML file.
Designer Portfolio Website
+3Six tilted cards hover round a fading headline on calm grey, one red portrait card, editorial case studies.
Developer Portfolio Website
+3A dark personal site for engineers with case studies, writing, talks, a résumé and a contact form.
Editorial SaaS Website
+3Navy split hero, a five-line serif headline beside a documentary still, slanted bands and one cobalt accent.
Glassmorphism Website Template
+3Frosted glass pills on a near-black film, a huge serif headline with one italic word and an email capture.
Hardware Product Website
+3Huge hairline model names on silver studio shots, frosted spec cards, a to-scale lineup and a hardware bento.
Interactive Architecture Diagram
+3An offline, clickable system diagram built from a checked JSON model, with the evidence behind each box.
Interactive Grid Hero
+3A dark grid of fine strands that bends toward the cursor and rolls a glowing ring out from every click.
Knowledge Graph Explorer
+3Turn project notes into an offline, searchable graph where every claim links back to its source line.
KPI Dashboard Template
+3Four KPI tiles with change chips over a glowing line chart, a breakdown table and target bars on warm paper.
Landing Page from AI Mockups
+3See three full-page designs first, pick one, and your agent builds it as clean, responsive code.
Magazine Website Template
+3A print-quality magazine site with articles, topics, a small shop and subscriptions, as one HTML file.
Particle Animation Hero
+3Copy on warm paper beside a turning sphere of ink and teal dots that reshapes per idea and scatters on scroll.
Personal Brand Website
+3A portrait feathered into warm paper under a thin bracket, with light-and-bold statements on either side.
Cinematic Product Launch Page
+3Film-lit near-black page: serif title card over drifting light, letterboxed night scene, reservation form.
Admin Dashboard Template
+3A working back-office console with charts, tables, kanban and calendar, built as one offline HTML file.
SaaS Landing Page Template
+3A calm, light marketing site for a software product with a working product console, pricing and sign-up.
Scrapbook Portfolio Website
+3A multi-page online CV made of paper objects, with case studies and a printable resume.
Sneaker Store Website Template
+3A complete footwear or apparel shop with catalog, product pages, bag and demo checkout in one HTML file.
Workflow Automation Landing Page
+3Graphite page, small left-aligned headline, and a live node graph below that runs, retries and streams logs.
Questions
Where does the data come from?
Anything with a date per record. The bundled script reads git log output, CSV files with a date column, JSON arrays or plain lists of timestamps, and writes one count per day.
Does it need a charting library?
No. The React version only needs React and the HTML version needs nothing. Both draw the grid with plain elements and work in light and dark mode.
How are the colour levels decided?
By default from the quartiles of your non-empty days, so a quiet year still uses the full ramp. You can set fixed thresholds when the numbers carry a fixed meaning.
Why not let the image model draw my stats?
Image models can get numbers wrong. The skill generates a text-free background with PopNow and places your real totals and streaks on top in HTML.